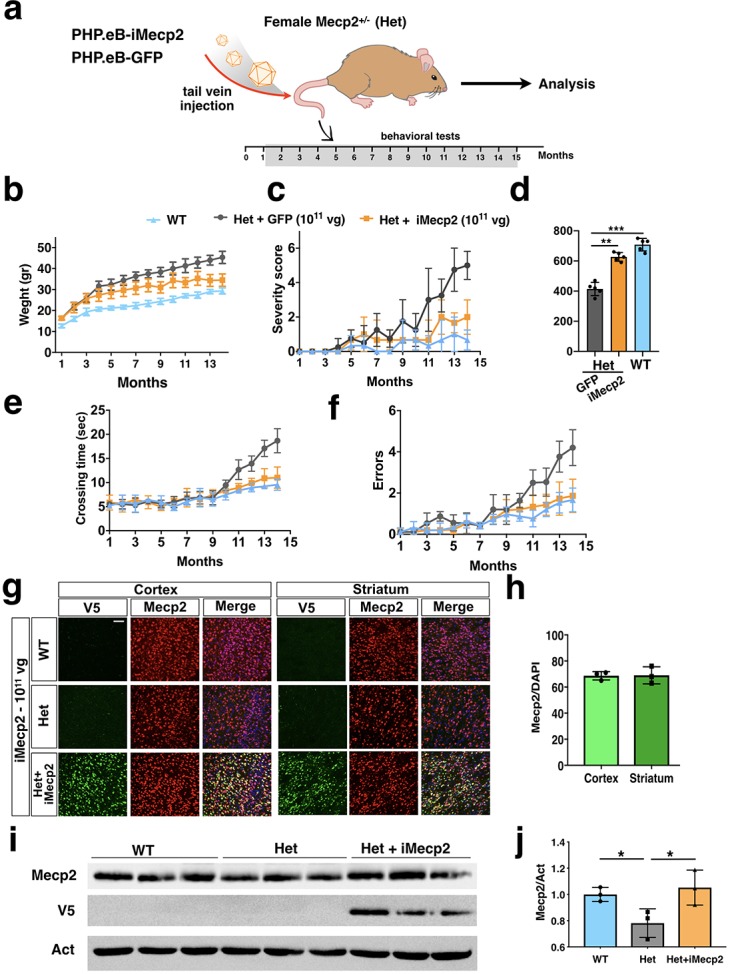
Figure 7. PHP.eB-iMecp2 gene transfer in Mecp2+/- females.
(a) Illustration of the experimental setting to restore the expression of Mecp2 in heterozygous (Het) animals by means of AAV-PHP.eB. (b) Mouse body weight was monitored every two weeks and represented as mean of each group. (c) General phenotypic assessment evaluated through aggregate severity score. (d) Spontaneous locomotor activity was tested in a spontaneous field arena and shown as quantification of travelled total distance. All groups of animals were tested for motor coordination using beam balance test and quantified as crossing time (e) and number of errors (f) (WT untreated [n = 8], Het treated with GFP 1×10¹¹ vg/mouse [n = 6], Het treated with iMecp2 virus 1×10¹¹ vg/mouse [n = 6]). (g) High magnification immunostaining for Mecp2 and V5 in cortex, striatum and cerebellum derived from WT, Mecp2+/- (Het) untreated and Het treated with PHP.eB-iMecp2 (1×10¹¹ vg/mouse) brains. Nuclei were stained with DAPI (merge panels). (h) Bar graphs showing the fraction of V5 positive on the total DAPI positive in cortex and striatum (n = 3). (i) Western-blot analysis to quantify Mecp2 over Actin protein levels in cortex derived from WT, Het untreated and treated with iMecp2 (1×10¹¹) animals and (j) corresponding densitometric quantification expressed in arbitrary units (right panel) (n = 3 for WT, n = 3 Het untreated; n = 3 Het treated with PHP.eB-iMecp2 1011 vg/mouse) *p<0.001 as compare to WT and Het treated with PHP.eB-iMecp2 (ANOVA-one way, Tukey’s post hoc test). Error bars, SD. **p<0.01. ANOVA-two way (b, c, e, f) or ANOVA-one way (d) with Tukey’s post hoc test.

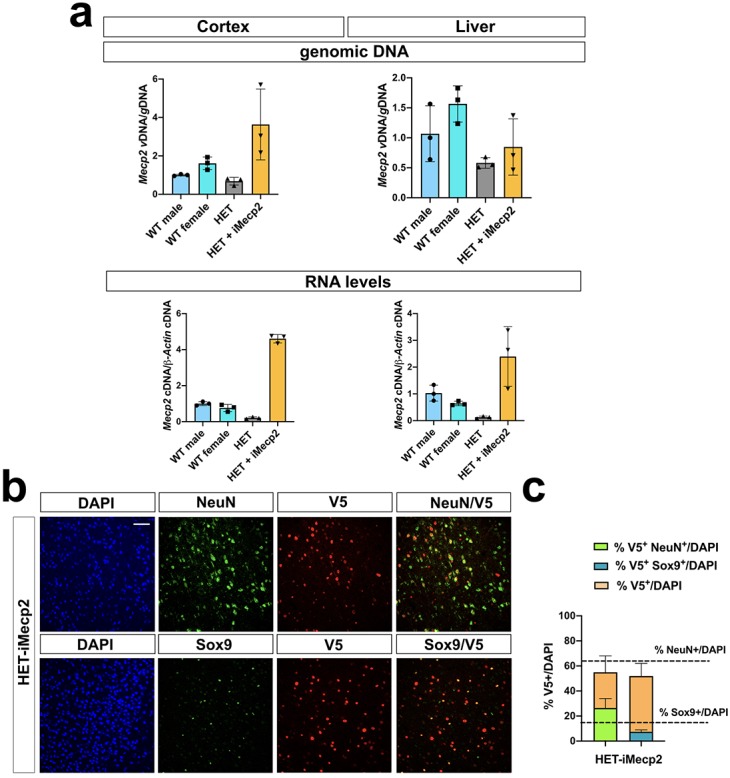
Figure 7—figure supplement 1. Characterization of iMecp2 transgene expression in brain and liver of Mecp2+/- animals.

