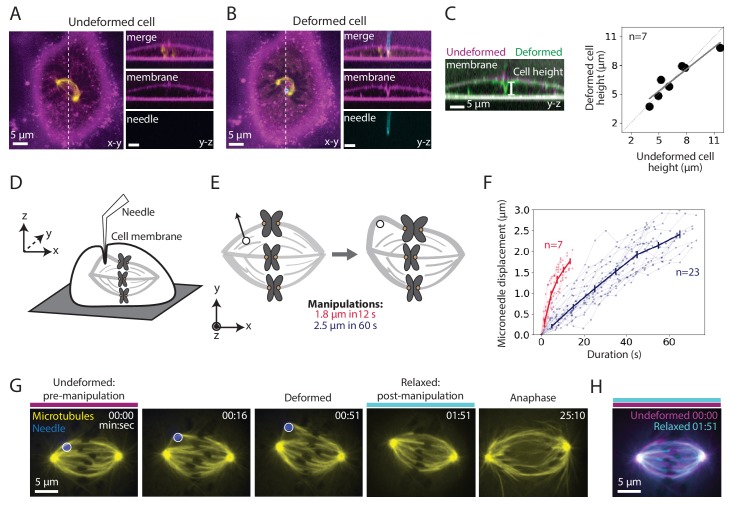
Figure 1. Microneedle manipulation can exert local forces with spatiotemporal control on the mammalian spindle.
See also Figure 1—figure supplement 1 and Figure 1—video 1. (A–B) Representative PtK2 cell (GFP-tubulin, yellow) and membrane label (CellMask Orange, magenta) (A) before (undeformed cell) and (B) during (deformed cell) microneedle (Alexa-647, blue) manipulation. x-y and y-z views displayed (left and right panels). y-z view taken along the white dashed line shown in the left panels. (C) Left: Overlay of the y-z view of the membrane labeled images before (undeformed, magenta) and during (deformed, green) microneedle manipulation, in order to compare membrane shape and cell height (white line) adjacent to the microneedle due to manipulation. Right: Cell height adjacent to the microneedle, measured using the membrane label, in its undeformed versus deformed state (n = 7 cells, Spearman R coefficient = 0.93, p=0.003, Pearson R coefficient = 0.94, p=0.002). Dashed line represents no change in cell height. Solid grey line is the linear regression fit to the data (r2 = 0.88). (D) Schematic showing a very local deformation of the cell by the microneedle during manipulation, based on (A–C). (E) Schematic of the microneedle (black circle) manipulation assay used throughout this study, pulling (arrow) on a spindle’s outer k-fiber for two different magnitudes and durations. (F) Microneedle displacement over time for two different manipulation datasets: 12 s (red, n = 7 cells) and 60 s (navy, n = 23 cells) pulls. Plot shows mean ± SEM. (G) Timelapse images of the representative response of a metaphase spindle in a PtK2 cell (GFP-tubulin, yellow), when its outer k-fiber is deformed by the microneedle (Alexa-647, blue, white circle) by 2.5 μm over 60 s. The spindle enters anaphase about 20 min after manipulation. Microneedle begins moving at 00:00 (first frame). Scale bar = 5 μm. Time in min:sec. (H) Overlay of the tubulin labeled images of the spindle (G) pre-manipulation (undeformed, magenta) and post-manipulation and microneedle removal (relaxed, cyan). The spindle’s structure is similar pre- and post-manipulation, after correcting for spindle movement.
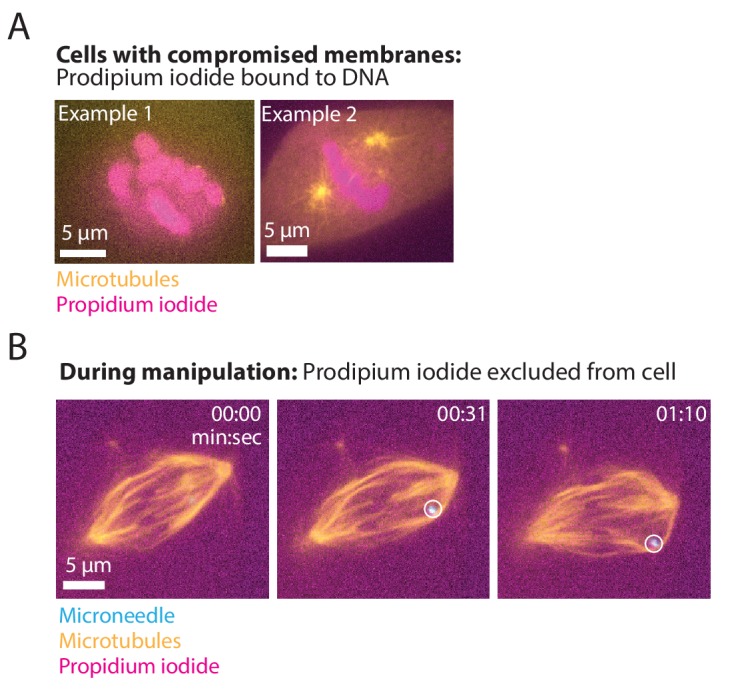
Figure 1—figure supplement 1. Propidium iodide remains outside cells during microneedle manipulation.


