. 2020 Mar 19;9:e53807. doi: 10.7554/eLife.53807

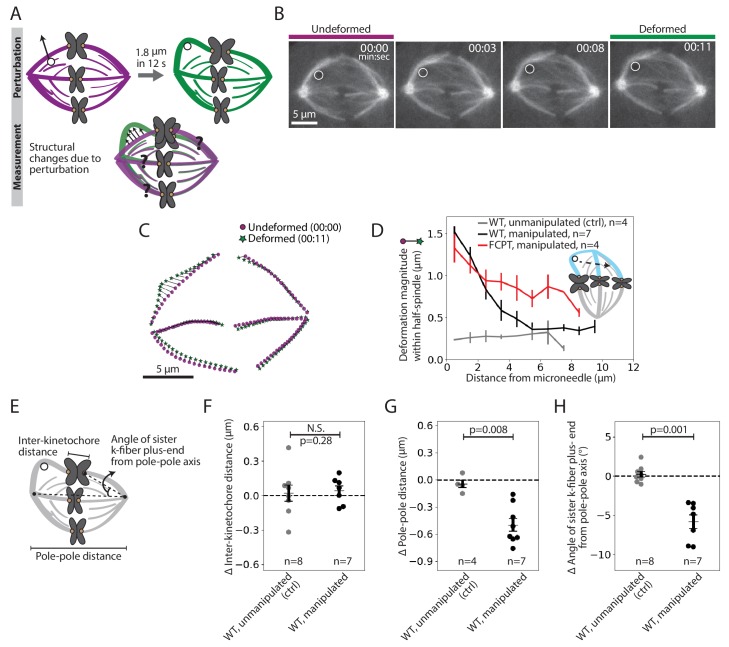
Figure 2. Pulling on kinetochore-fibers reveals the spindle’s ability to retain local architecture near chromosomes under seconds-long forces.

See also Figure 2—figure supplements 14 and Figure 2—video 1. (A) Schematic of the assay to measure spindle deformation under local force: manipulation of the outer k-fiber for 12 s (perturbation) and generation of strain maps between undeformed (magenta) and deformed (green) spindles (measurement). (B) Timelapse images of a representative PtK2 metaphase spindle (GFP-tubulin, grey) during a 12 s manipulation, with microneedle position (white circle) displayed on images. Scale bar = 5 μm. Time in min:sec. (C) Strain map showing structural changes between undeformed (00:00, magenta circles) and deformed (00:11, green stars) spindles shown in (B), after correcting for spindle movement. Strain corresponds to the distance (black line) between magenta circles (undeformed spindle) and green stars (deformed spindle). (D) Magnitude of deformation in the structure (mean ± SEM) versus distance from the microneedle in unmanipulated WT (control, grey, n = 4 cells), manipulated WT (black, n = 7 cells) and manipulated FCPT-treated (positive control, red, n = 4 cells) spindles. (E) Schematic of the three measurements made in (F,G,H): Inter-kinetochore distance (measured between the manipulated k-fiber’s and its sister’s plus-ends), pole-pole distance, and angle between the sister k-fiber plus-end (opposite the manipulated k-fiber) and the pole-pole axis. (F) Change in inter-kinetochore distance in WT unmanipulated (control, n = 8 kinetochore pairs from 4 cells) and WT manipulated (between undeformed and deformed, n = 7 kinetochore pairs from 7 cells) spindles, measured over 12 s. There is no significant difference in the inter-kinetochore distance upon manipulation (p=0.28, Mann-Whitney U test). (G) Change in pole-pole distance in WT unmanipulated (control, n = 4 cells) and WT manipulated (between undeformed and deformed, n = 7 cells) spindles, measured over 12 s. Pole-pole distance decreases in manipulated spindles (p=0.008, Mann-Whitney U test). Plot shows mean ± SEM. (H) Change in angle of sister k-fiber plus-end with respect to the pole-pole axis, in WT unmanipulated (control, n = 8 k-fibers from 4 cells) and WT manipulated (between undeformed and deformed, n = 7 k-fibers from 7 cells) spindles, measured over 12 s. The sister k-fiber moves in towards the pole-pole axis in manipulated spindles (p=0.001, Mann-Whitney U test). Plot shows mean ± SEM.

Figure 2—source data 1. This spreadsheet contains the magnitude of deformation within the half-spindle versus the distance from the microneedle position in WT unmanipulated, WT manipulated and FCPT manipulated spindles manipulated over 12 s in PtK2 cells (Figure 2D).
This spreadsheet also contains the change in inter-kinetochore distance (Figure 2F), pole-pole distance (Figure 2G) and angle of sister k-fiber plus-end from the pole-pole axis (Figure 2H) in unmanipulated and manipulated PtK2 cells.

Figure 2.

Figure 2—figure supplement 1. Kinetochore-fiber length does not change over 12 s manipulations.
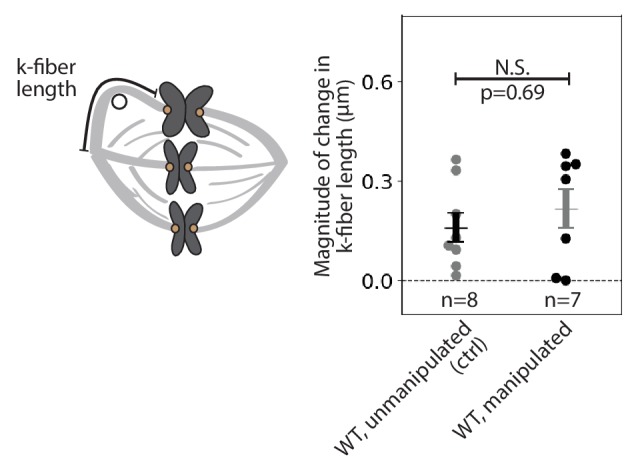
Figure 2—figure supplement 1.

Magnitude of change in k-fiber length in PtK2 unmanipulated (control, n = 8 k-fibers from 4 cells) and manipulated spindles (between undeformed and deformed, n = 7 k-fibers from 7 cells), measured over 12 s. Mean ± SEM displayed over points. There is no significant difference in k-fiber length during manipulation over this timescale (p=0.69, Mann-Whitney U test).
Figure 2—figure supplement 1—source data 1. This spreadsheet contains the change in k-fiber length in unmanipulated and manipulated spindles from 12 s manipulations in PtK2 cells.
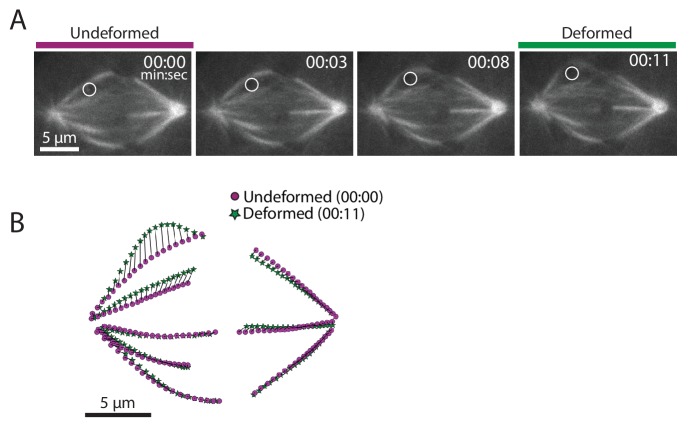
Figure 2—figure supplement 2. Additional example of a spindle manipulated for 12 s and its corresponding strain map.

Figure 2—figure supplement 2.

(A) Timelapse images of a PtK2 metaphase spindle (GFP-tubulin, grey) during a 12 s manipulation, with microneedle position (white circle) displayed on images. Scale bar = 5 μm. Time in min:sec. (B) Strain map showing structural changes between undeformed (00:00, magenta circles) and deformed (00:11, green stars) spindles shown in (A), after correcting for spindle movement. Strain corresponds to the distance (black line) between magenta circles (undeformed spindle) and green stars (deformed spindle).
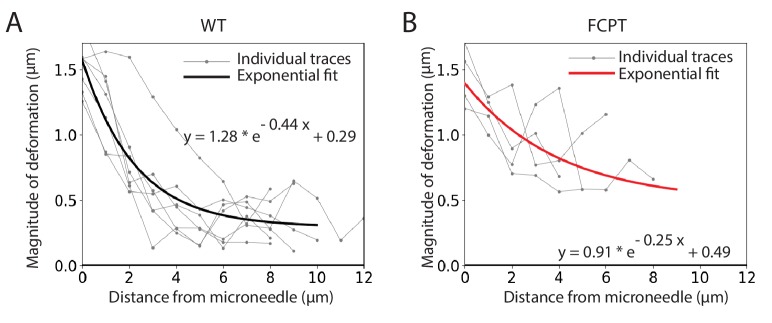
Figure 2—figure supplement 3. Estimating the exponential decay rate of spindle deformations over space.

Figure 2—figure supplement 3.

Magnitude of deformation in the structure versus distance from the microneedle in PtK2 GPF-tubulin (A) WT manipulated (n = 7 cells) and (B) FCPT-treated manipulated (n = 4 cells) spindles, due to 12 s manipulations. Thin grey lines are individual traces, thick lines (WT, black; FCPT, red) are exponential decay functions fit to the data. The equation that produced the best fits to the data is displayed.
Figure 2—figure supplement 3—source data 1. This spreadsheet contains the magnitude of deformation within the half-spindle vs. the distance from the microneedle position in WT and FCPT spindles manipulated over 12 s in PtK2 cells (same as Figure 2D).
Figure 2—figure supplement 4. The angle between sister kinetochore-fibers is preserved in 12 s manipulations.
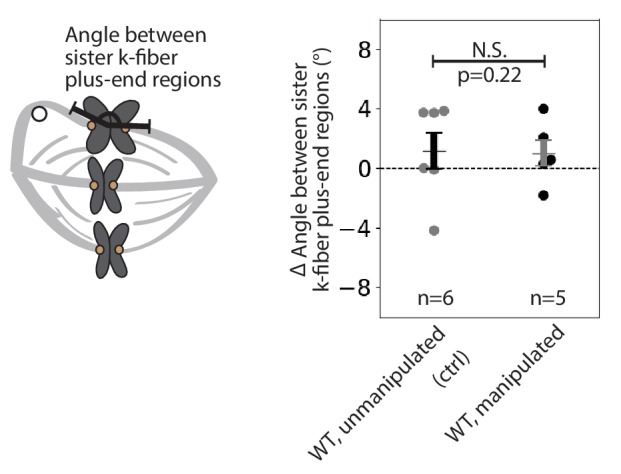
Figure 2—figure supplement 4.

Change in angle between sister k-fiber plus-end regions in the outer pair, in PtK2 unmanipulated (control, n = 6 k-fiber pairs from 4 cells) and manipulated (n = 6 k-fiber pairs from 6 cells) spindles, measured over 12 s. There is no significant change in angle between sister k-fibers due to the manipulation (p=0.22, Mann-Whitney U test).
Figure 2—figure supplement 4—source data 1. This spreadsheet contains the change in angle between sister k-fiber plus-ends in unmanipulated and manipulated spindles over 12 s, in PtK2 cells.
Figure 2—video 1. The spindle locally deforms under seconds-long forces.
Download video file (634.9KB, mp4)
Microneedle manipulation of a metaphase spindle in a PtK2 cell. The microneedle (Alexa-647, white circle) pulls (time 00:00) on the spindle’s outer k-fiber (GFP-tubulin, grey) over 12 s and deforms the spindle. The k-fiber bends around the microneedle and the rest of the spindle structure appears unaffected by the force exerted, indicating a local structural response. Scale bar = 5 μm. Time in min:sec. Video was collected using a spinning disk confocal microscope, at a rate of 4 frames per second during manipulation. Video has been set to play back at constant rate of 5 frames per second. Movie corresponds to still images from Figure 2B.