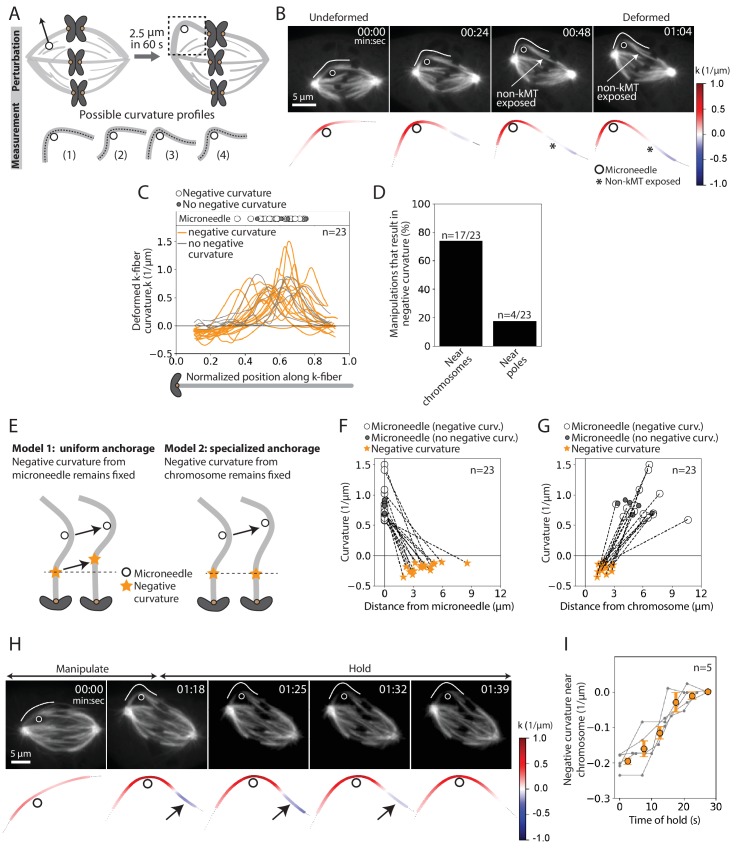
Figure 3. The deformed kinetochore-fiber’s shape indicates specialized, short-lived crosslinking to the spindle near chromosomes.
See also Figure 3—figure supplements 1–3 and Figure 3—videos 1 and 2. (A) Schematic of the assay to probe the physical basis of k-fiber anchorage in the spindle: manipulation of the outer k-fiber for 60 s and quantification of local curvature along its length. The absence of k-fiber negative curvature (1) would suggest pivoting at poles and chromosomes. K-fiber negative curvature at poles (2) or chromosomes (3) or at both (4) would suggest it is laterally anchored there and prevented from pivoting. (B) Top: Timelapse images of a representative PtK2 metaphase spindle (GFP-tubulin, grey) during a 60 s manipulation, with microneedle position (white circle) and traced manipulated k-fiber (white) displayed on the images. Scale bar = 5 μm. Time in min:sec. Bottom: Curvature mapped along highlighted k-fiber for each time point in the top panel (blue, negative curvature; red, positive curvature). This manipulation can expose contact points (asterisk) between the k-fiber and non-kMTs. (C) Local curvature of deformed k-fibers for normalized positions along the k-fiber (n = 23 cells). Most k-fibers exhibit negative curvature near the chromosome (orange), and a few show no negative curvature (grey) near the chromosome. Few k-fibers also show negative curvature near poles. Scatter plot of microneedle positions shown above (inset). (D) Percentage of k-fiber curvature profiles with negative curvature less than −0.1 1/μm, proximal to chromosomes (n = 17/23 cells) and the pole (n = 3/23 cells). (E) Schematic of two possible outcomes of manipulating the outer k-fiber at different locations along its length: either the negative curvature position (orange star) remains fixed relative to the microneedle (black circle) position (uniform anchorage along the k-fiber, Model 1) or remains fixed relative to the chromosome (specialized, non-uniform anchorage near chromosome, Model 2). (F–G) Position of the curvature maxima (microneedle, white circle) and curvature minima (negative curvature, orange star) (F) measured from the microneedle position (n = 23 cells), and (G) measured from the chromosome (n = 23 cells). Dashed lines connect the maxima (microneedle) and minima (negative curvature) for a given manipulation. The negative curvature position is tightly distributed near chromosomes, regardless of the microneedle’s position, supporting a specialized crosslinking model (Model 2, E). Plot also shows microneedle positions of manipulations that do not result in negative curvature (grey circles). (H) Top: Timelapse images of a PtK2 metaphase spindle (GFP-tubulin, grey) manipulate-and-hold experiment to probe the timescale of k-fiber reinforcement in the spindle center, performing a 60 s manipulation and then holding the microneedle (white circle) in place to measure when the negative curvature in the manipulated k-fiber (white trace) disappears (1:39, 21 s after 1:18 hold started). Scale bar = 5 μm. Time in min:sec. Bottom: Curvature mapped along highlighted k-fiber for each point in the top panel (blue, negative curvature; red, positive curvature). Negative curvature (black arrow) disappears over 21 s of holding time. (I) Curvature minima near chromosome as a function of time the microneedle has been held in place (n = 5 cells). Negative curvature disappears after holding for 20 s. Plot shows mean ± SEM (orange).


