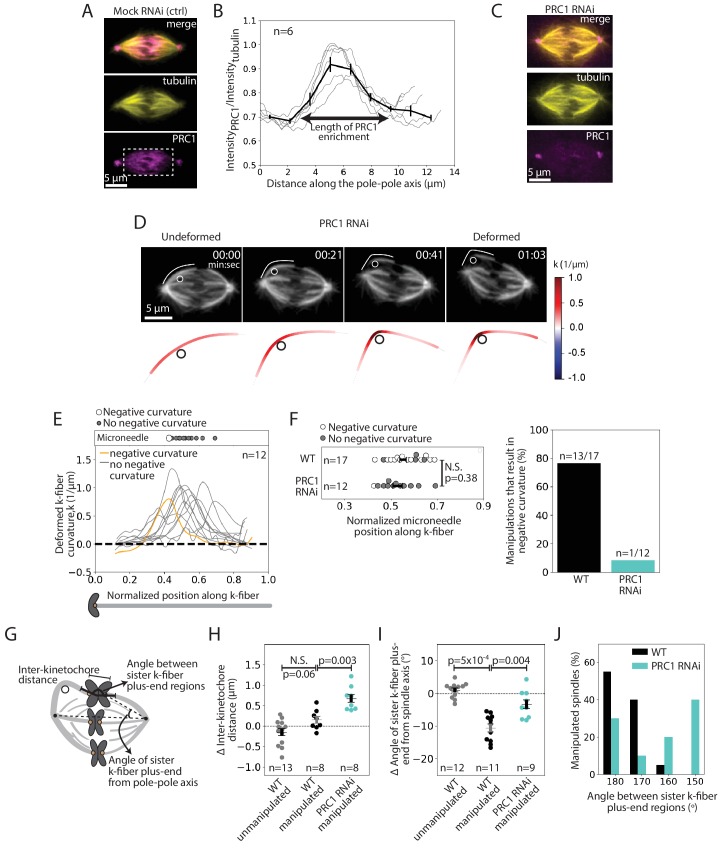
Figure 4. The microtubule crosslinker PRC1 mediates the specialized and short-lived kinetochore-fiber reinforcement near chromosomes.
See also Figure 4—figure supplements 1–2 and Figure 4—video 1. (A) Immunofluorescence images of a representative PtK2 mock RNAi (control) metaphase spindle showing where PRC1 is localized in the spindle (tubulin, yellow; PRC1, magenta). White box (bottom panel) shows the region in which intensity (B) was quantified. Scale bar = 5 μm. (B) Fluorescence intensity ratio of PRC1 to tubulin along the pole-pole axis (n = 6 cells), showing PRC1 localization in the spindle center. Plot shows mean ± SEM. (C) Immunofluorescence images of a representative PtK2 PRC1 RNAi metaphase spindle (tubulin, yellow; PRC1, magenta), showing PRC1 depletion. Scale bar = 5 μm. (D) Top: Timelapse images of a representative PtK2 metaphase PRC1 RNAi spindle (GFP-tubulin, grey) during a 60 s manipulation, showing microneedle position (white circle) and traced manipulated k-fiber (white). Scale bar = 5 μm. Time in min:sec. Bottom: Curvature mapped along traced k-fiber for each point in the top panel (blue, negative curvature; red, positive curvature), showing the absence of negative curvature near chromosomes without PRC1. (E) Local curvature of deformed k-fibers for normalized positions along the k-fiber (n = 12 k-fibers in 12 cells). Most k-fibers exhibit no negative curvature (grey) and one shows negative curvature similar to WT k-fibers (orange). Scatter plot of microneedle positions shown above (inset). (F) Left: Distribution of microneedle positions along the k-fiber in WT (n = 17 cells) and PRC1 RNAi (n = 12 cells) spindles, after datasets are minimally down-sampled to maximize microneedle position overlap between them. There is no significant difference in microneedle position in the two conditions (p=0.38, Mann-Whitney U test). Plot shows mean ± SEM. Right: Percentage of deformed k-fiber profiles showing negative curvature near chromosomes in WT and PRC1 RNAi manipulated spindles, showing loss of negative curvature without PRC1. (G) Schematic of the three measurements made in (H,I,J): Inter-kinetochore distance between the manipulated k-fiber and its sister, angle between the sister k-fiber plus-end (opposite the manipulated k-fiber) and the pole-pole axis, and the angle between sister k-fiber plus-end regions. (H) Change in inter-kinetochore distance in WT unmanipulated (control, n = 13 kinetochore pairs from 6 cells), WT manipulated (n = 8 kinetochore pairs from 8 cells) and PRC1 RNAi manipulated (n = 8 kinetochore pairs from 8 cells) spindles, measured over 60 s. Inter-kinetochore distance after manipulation is significantly higher in spindles with PRC1 RNAi than WT (p=0.003, Mann-Whitney U test). Plot shows mean ± SEM. (I) Change in angle of sister k-fiber plus-end with respect to the pole-pole axis in WT unmanipulated (control, n = 12 k-fibers from 6 cells) and WT manipulated (n = 11 k-fibers from 11 cells) and PRC1 RNAi manipulated (n = 9 k-fibers from 9 cells) spindles, measured over 60 s. The sister k-fiber moves less (smaller angle) towards the pole-pole axis after manipulation in PRC1 RNAi spindles compared to WT (p=0.004, Mann-Whitney U test). Plot shows mean ± SEM. (J) Distribution of the angle between sister k-fiber plus-end regions at the end of manipulation in WT (n = 20 cells) and PRC1 RNAi (n = 10 cells) spindles, measured between the chromosome-proximal regions of the k-fibers.
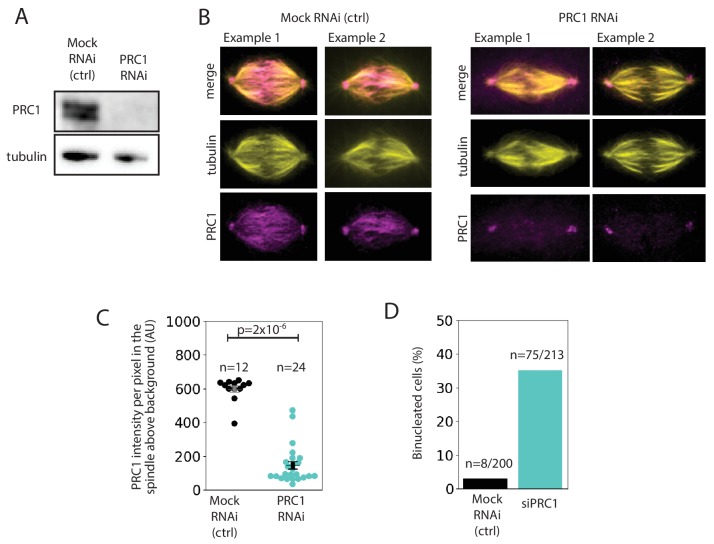
Figure 4—figure supplement 1. Validation of PRC1 depletion by RNAi.
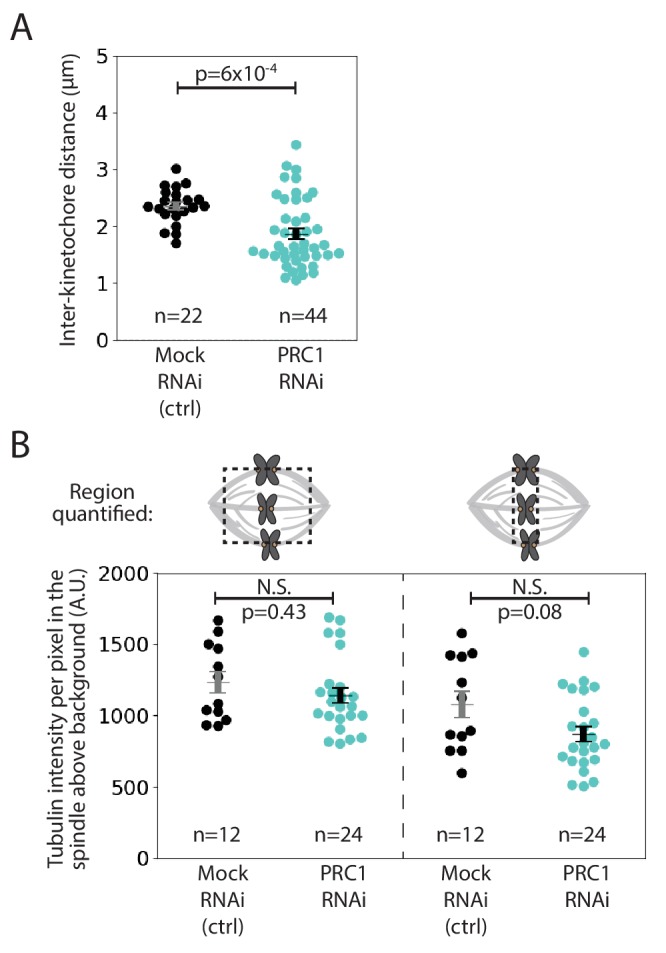
Figure 4—figure supplement 2. Immunofluorescence quantifications of inter-kinetochore distance and tubulin intensity between PRC1 RNAi and mock RNAi spindles.


