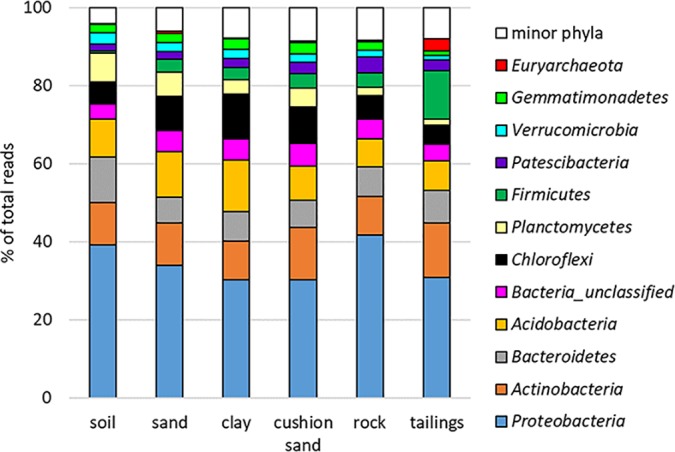
FIG 2.

Percentages of total reads of dominant lineages (phylum level) in different layers of the NIT cover system and underlying tailings at the Kam Kotia Mine, as determined by high-throughput 16S rRNA amplicon sequencing. Minor phyla with relative abundance < 1% were grouped together.
