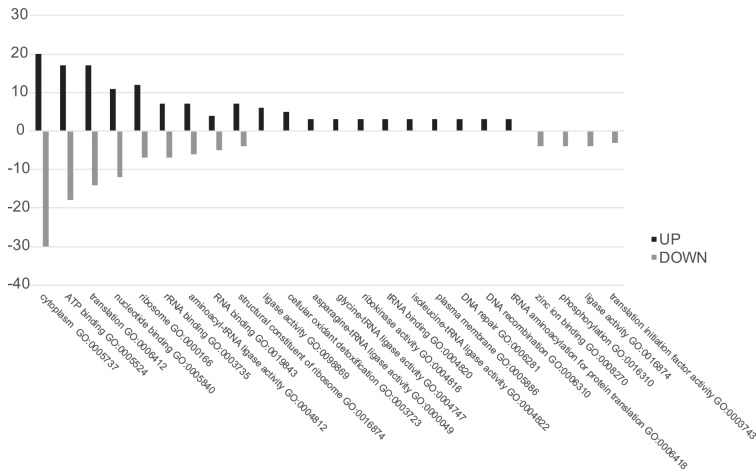
FIG 2.
Gene Ontology analyses of differentially expressed proteins. On the x axis, the Gene Ontology enriched terms are shown, and on the y axis, the percentage of enrichment is shown. Up, processes enriched in the Δeps_cluster mutant strain compared to the WT; Down, processes enriched in the WT compared to the mutant.

