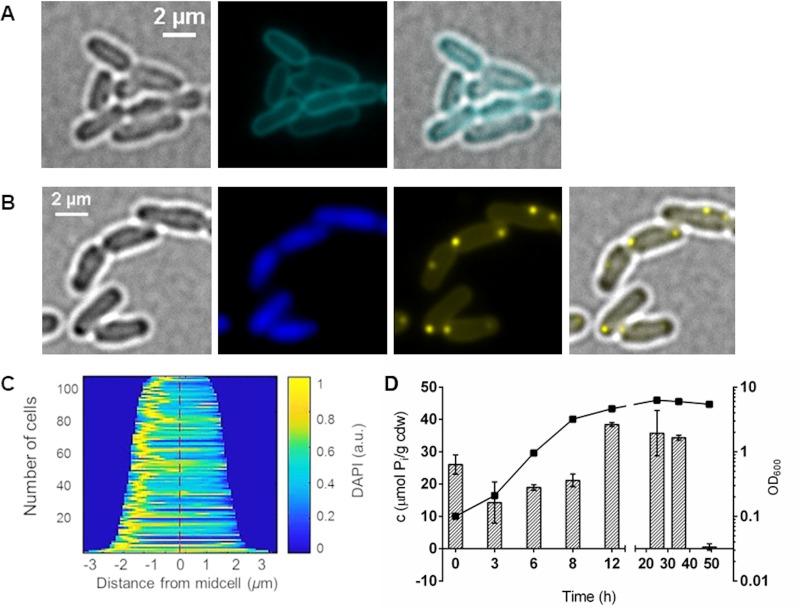
FIG 1.
Formation of polyP in A. tumefaciens. (A) Bacterial cells from exponential growth were stained with 10 μM LysoSensor green DND-189 and analyzed with a CFP filter. Merged images show an overlay of the CFP and bright-field channel. (B) LB-grown cells during exponential growth were stained with 0.5 μg/ml DAPI and imaged in bright-field fluorescence microscopy with a DAPI-DNA-specific or DAPI-polyP-specific filter. The microscopic image on the right is an overlay of bright-field microscopy and DAPI-polyP. (C) Demograph showing the localization of DAPI-polyP fluorescence by cell length. (D) The growth (OD600) and the amount of intracellular polyP on LB medium (measured as total inorganic phosphate in μmol per cell dry weight [cdw]) were determined at different growth stages. Error bars represent standard deviations of the results from three technical replicates. The deviation values for the OD values are too small to visualize.

