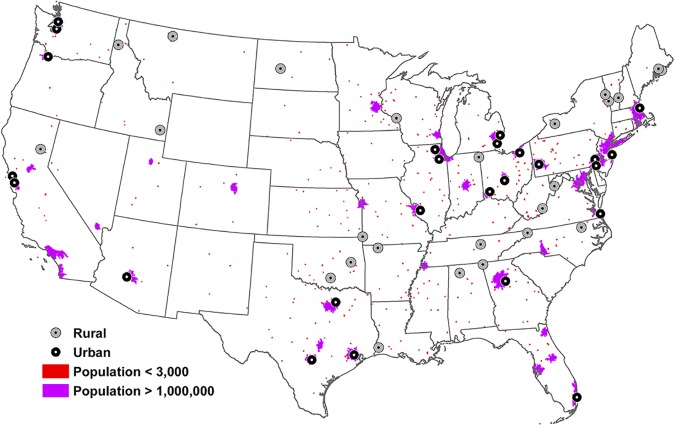
FIG 3.
Geospatial information system (GIS) map of selected wastewater treatment facilities. Gray circles with a black center represent rural facilities. Black circles with a gray center represent urban facilities. Purple-shaded areas indicate locales with a reported population of greater than 1,000,000 individuals (https://www.census.gov/geographies/mapping-files/time-series/geo/carto-boundary-file.html), and red-shaded areas depict regions with a population of less than 3,000 (75). The map was generated with ArcGIS ArcMap (version 10.3; ESRI, Redlands, CA) using public domain data layers (U.S. Census Bureau, Washington, DC).

