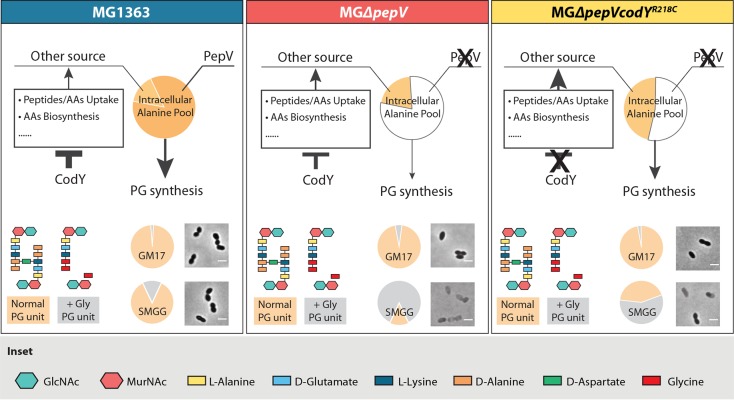
FIG 7.
Model showing the response to glycine of MG1363, MGΔpepV, and MGΔpepVcodYR218C. Relative contributions of intracellular alanine pools derived from PepV activity and from other sources are shown in the topmost pie charts in each panel. White, no contribution. Differences in the thicknesses of arrows and T-symbols show the relative degrees of contribution and inhibition, respectively. The cross indicates the deletion of pepV or the functional loss of CodY. Typical cell morphologies of the strains are shown in the bottom right of each panel. White bars, 2 μm. The composition of the peptidoglycan (PG) unit when cells were grown in GM17 or SMGG is shown at the bottom left of each panel. Relative ratios of normal and abnormal PG in GM17 and SMGG are shown by the small pie charts next to the microscopy images.

