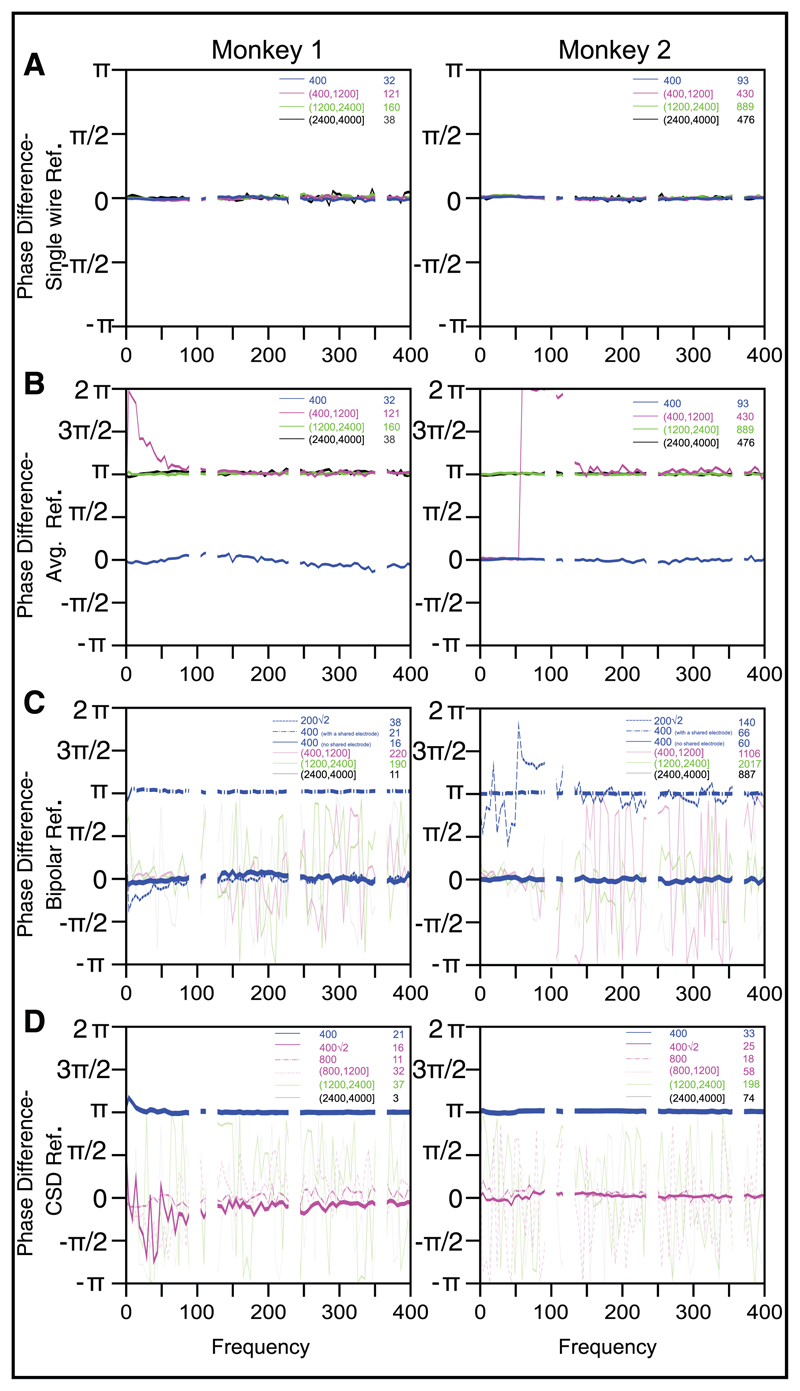
Figure 5.
Mean phase difference between electrode pairs, averaged across all the electrode pairs within a distance range. Same format and analysis interval as Figure 4. For the bipolar reference scheme, the distance ranges for which the referenced signals share a common component (0.2√2 and 0.4 mm) are shown in dashed and dashed-dotted blue lines. Distance range 0.4 mm with no shared common component is shown as a thicker solid blue line. For the CSD reference scheme, the distance ranges for which the referenced signals share a common component (0.4, 0.4√2 and 0.8 mm) are shown in thicker lines. For the bipolar reference, the phase difference due to the deterministic component could be either 0 or π depending on how the signal is referenced (e.g., if the voltages recorded from three nearby electrodes are V1, V2, and V3, the bipolar referenced signals could be BP1 = V1-V2 and BP2 = V2-V3, which would produce a phase difference of π; or it could be BP1 = V1-V2 and BP2 = V3-V2, which would produce a phase difference of 0). For CSD, the phase difference at 0.4 mm is π because CSD at electrode 1 has a V1-V2/4 term while CSD at electrode 2 has a V2-V1/4 term. Electrodes separated by 0.4√2 and 0.8 mm share two or one neighbors, respectively, so their CSDs have a common component that leads to a phase difference of 0. If we ignore these special cases, phase differences for the remaining electrode pairs show a random value (thin lines in C and D) and high circular standard deviation (Figures 6C and D), suggesting that phase differences are random.

