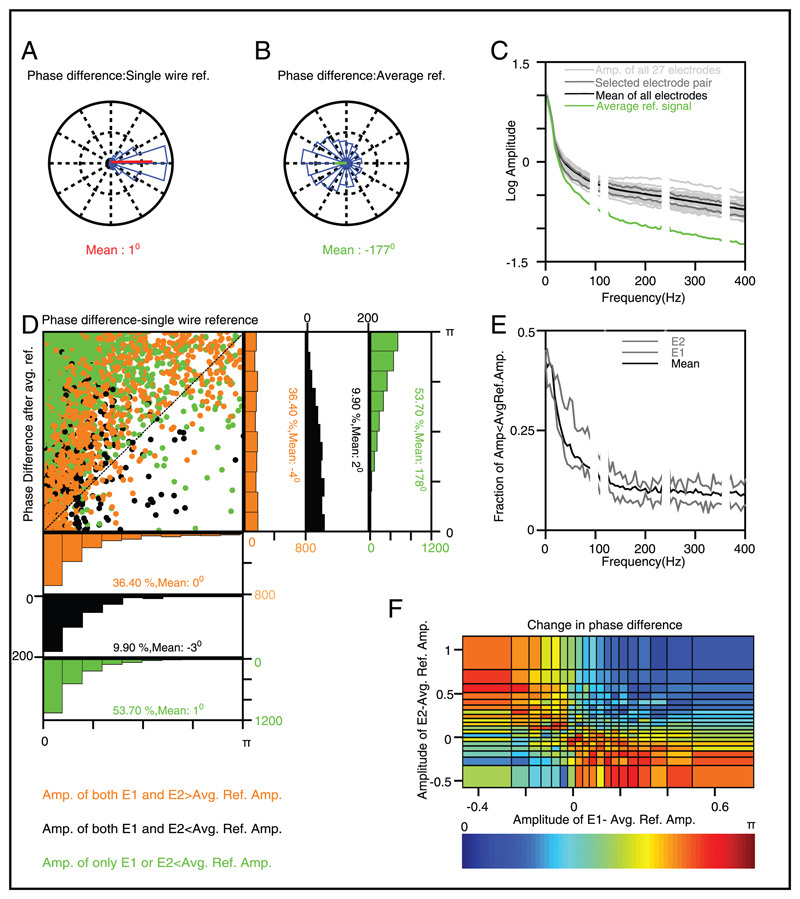
Figure 7.
Effect of average referencing on the phase difference between a pair of electrodes separated by approximately 1.65 mm, recorded from the baseline period of monkey 1 (300–100 ms interval before stimulus onset). (A) Distribution of single-wire referenced phase differences in the 5–25 Hz frequency range. (B) Distribution of phase differences for the same two electrodes but after the signals are average referenced. (C) Amplitude spectrum of individual electrodes (light gray), electrode pair selected for analysis (dark gray), the average amplitude spectrum of all the electrodes (black), and the average reference signal (green). (D) Scatter plot and the corresponding histograms of the absolute phase differences in the 5–25 Hz frequency range, separated based on the three possible relationships between the amplitudes of two electrode amplitudes and the average reference amplitude. The mean phase differences and the corresponding percentage of trials are shown in the respective insets. (E) Fraction of trials for which the signal amplitude was less than the average reference amplitude for the two electrodes (gray) and the mean of the fractions of all the electrodes (black). (F) Change in absolute phase difference after average referencing as a function of the amplitudes for the two electrodes minus the average reference amplitude.

