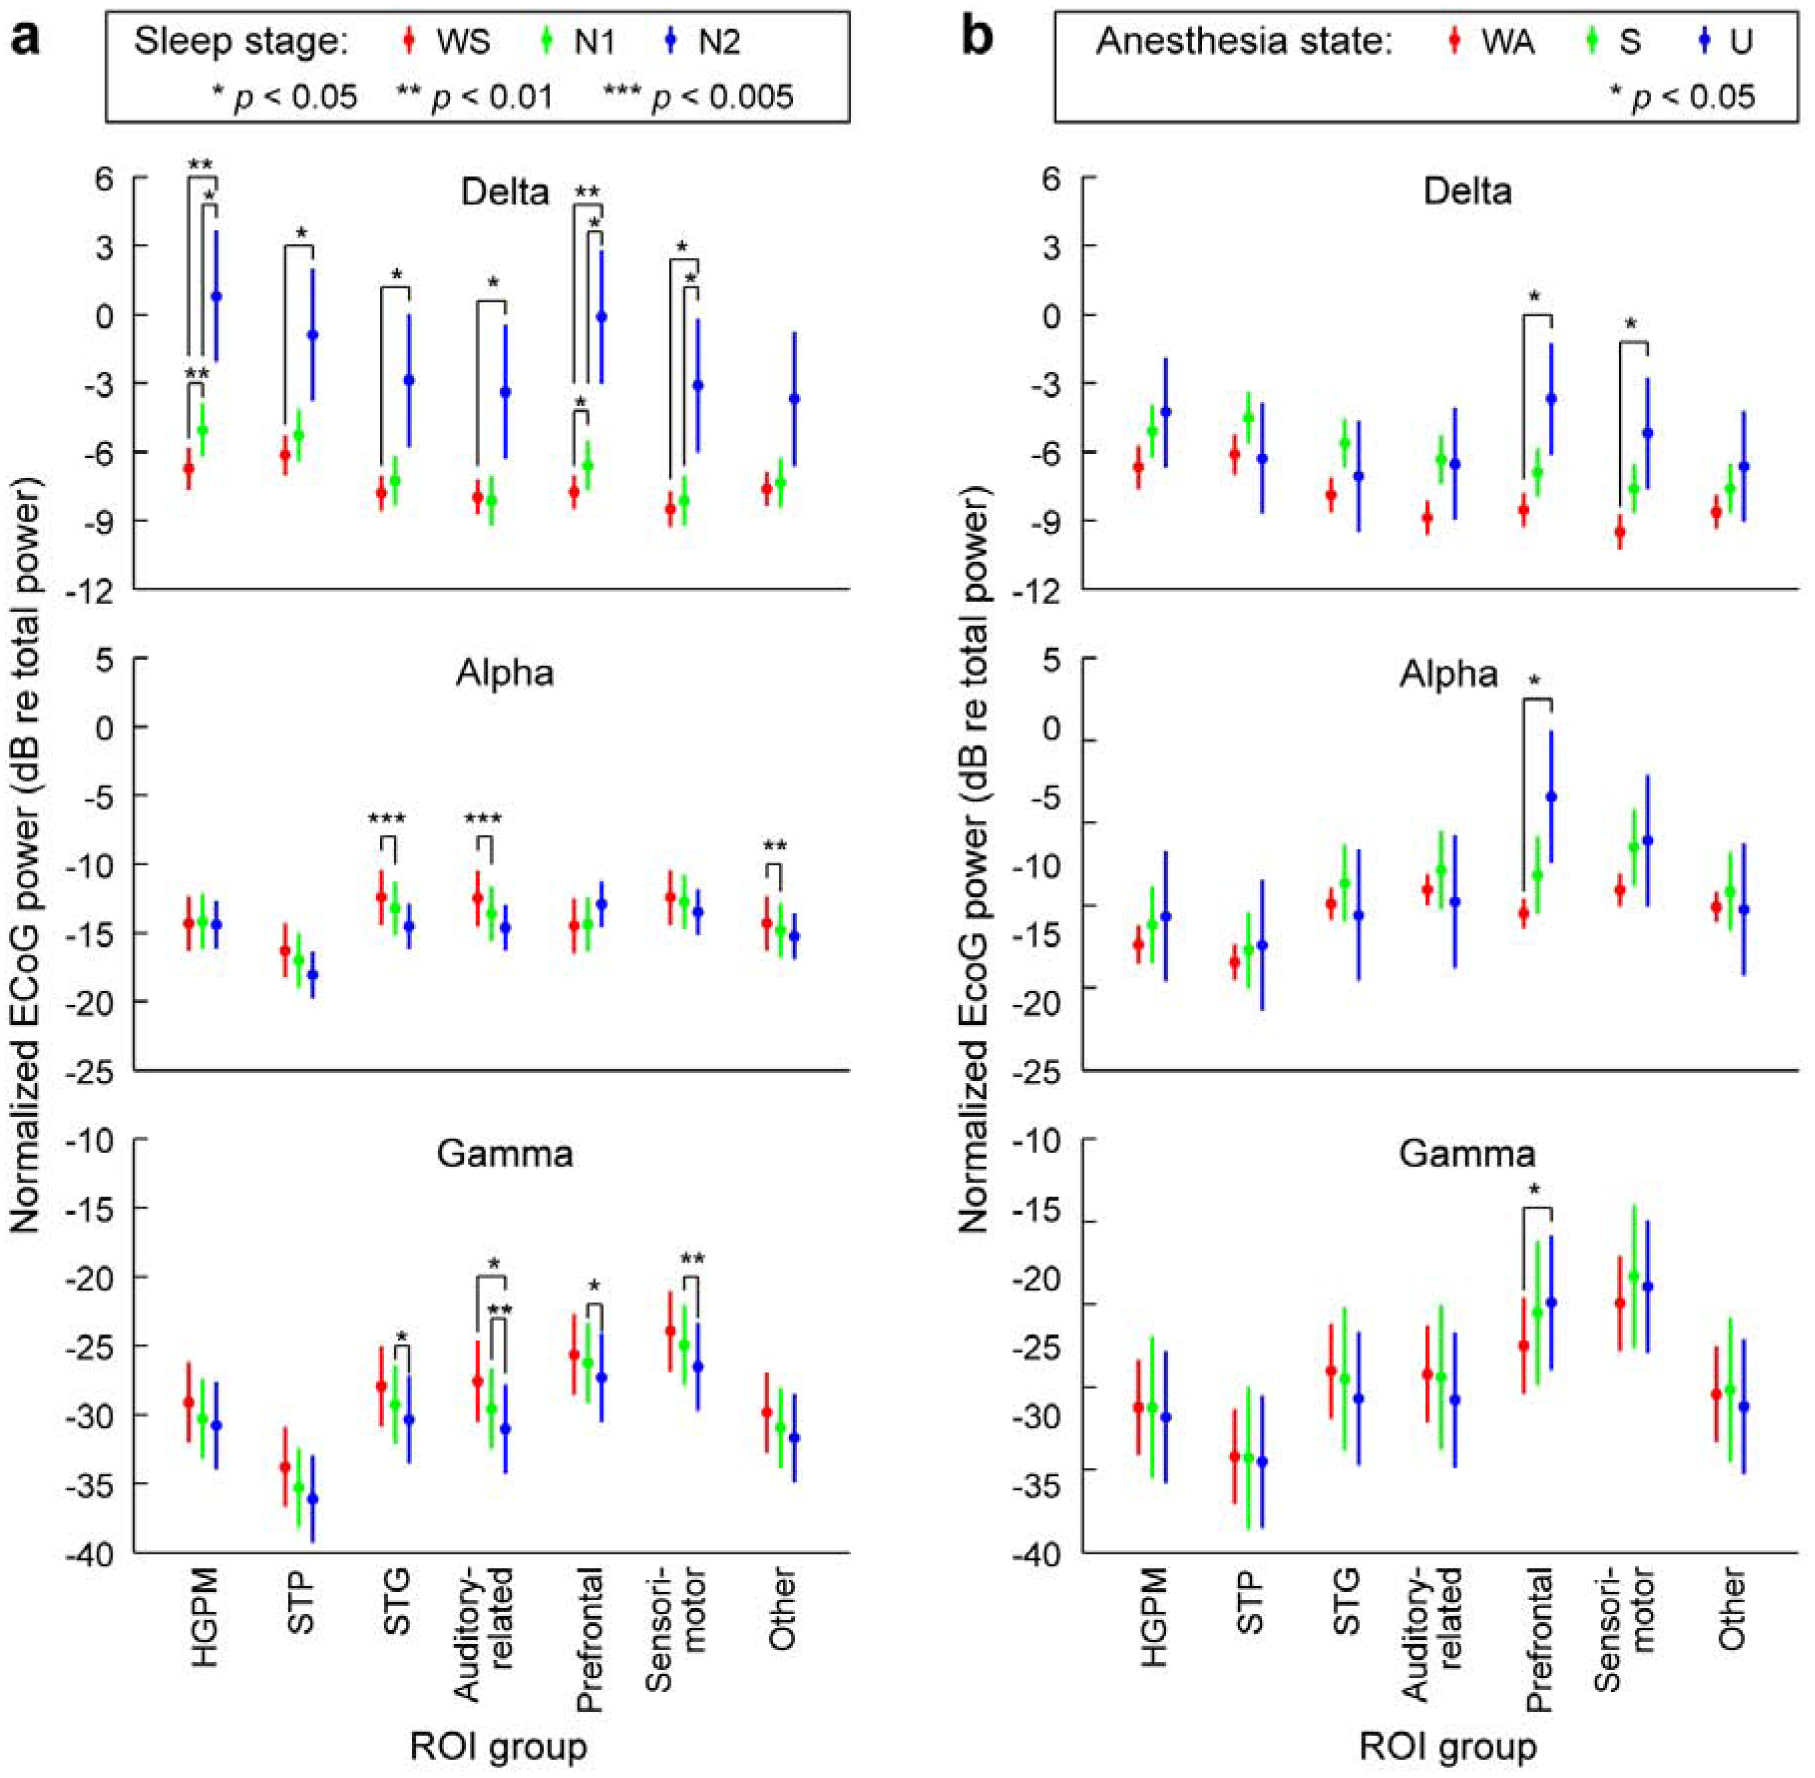
Fig. 2: Changes in ECoG band power across arousal states.

a, ECoG band power during sleep, plotted as marginal means and 95% confidence intervals. b, ECoG band power during anesthesia. Data from 5 subjects. Changes in delta, alpha, and gamma power are shown in top, middle and bottom rows, respectively. See Table 1 for definition of each region of interest (ROI) group. P-values were adjusted for multiple comparisons as described in Methods. WS: wake (sleep experiment), WA: wake (anesthesia experiment); S: sedated; U: unresponsive.
