
Figure 2.
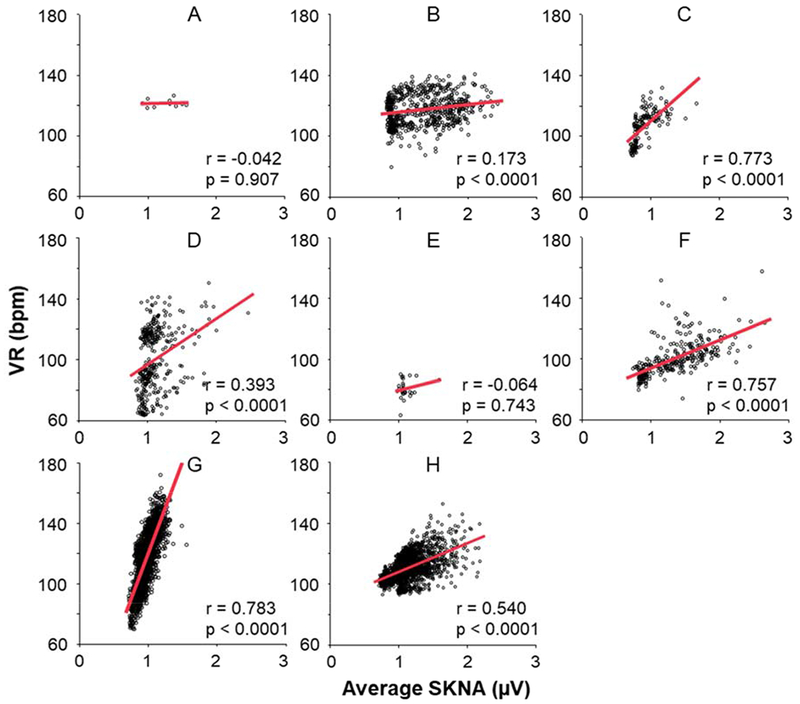
Correlation between aSKNA and VR during paroxysmal AF. A-H indicate patient ID in this study. The scatter plots show the correlation between aSKNA and VR every 60-s, and red lines mean the linear regression between aSKNA and VR. In a total of 6 patients, there were significant positive correlation between aSKNA and VR, and all the slopes of linear regression (red lines) indicated positive. aSKNA = average amplitude of SKNA.