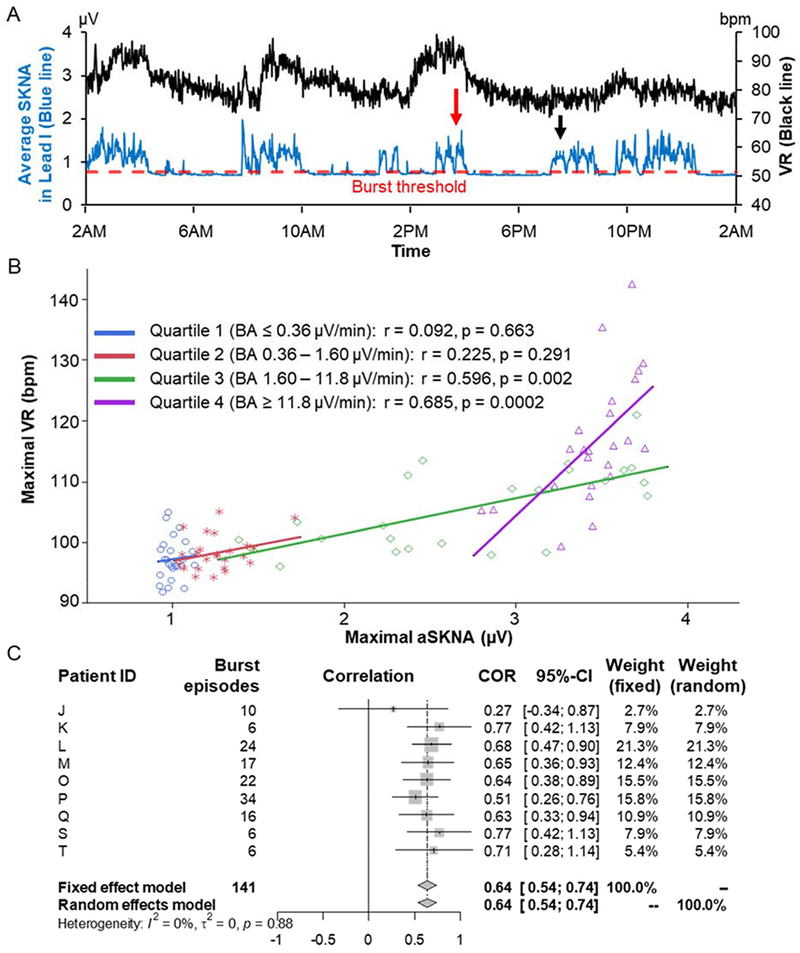
Figure 6.

VR and SKNA bursts. A) Average SKNA (aSKNA) from Lead I (blue line) and VR (black) in one-min windows over 24-hr from patient O. Red dotted line indicates the threshold of SKNA bursts, associating with VR acceleration. Red and black arrows correspond to the Figures 1B and 1C, respectively. The total SKNA burst and non-burst periods were 11 hrs and 13 hrs, respectively. B) Representative scatter plots from the patient L (a 67 year-old male with reduced left ventricular ejection fraction and enlarged left atrium), showing maximal VR and aSKNA during SKNA bursts in each quartile of the burst area. Each line segment indicates the linear regression. The highest quartile of the burst area (purple) shows higher aSKNA and VR and steeper positive linear regression. C) Forest plots of correlation coefficients between maximal VR and aSKNA during SKNA bursts in the highest quartile of the burst area (quartile 4). Patient ID are same in Figure 3. In random effects model, there was a positive correlation between maximal aSKNA and VR during SKNA bursts in the highest quartile of the burst area (0.64 [95% CI 0.54 – 0.74], p < 0.0001). COR = correlation; CI = confidence interval; I2 = I-squared; τ2 = Tau-squared.
