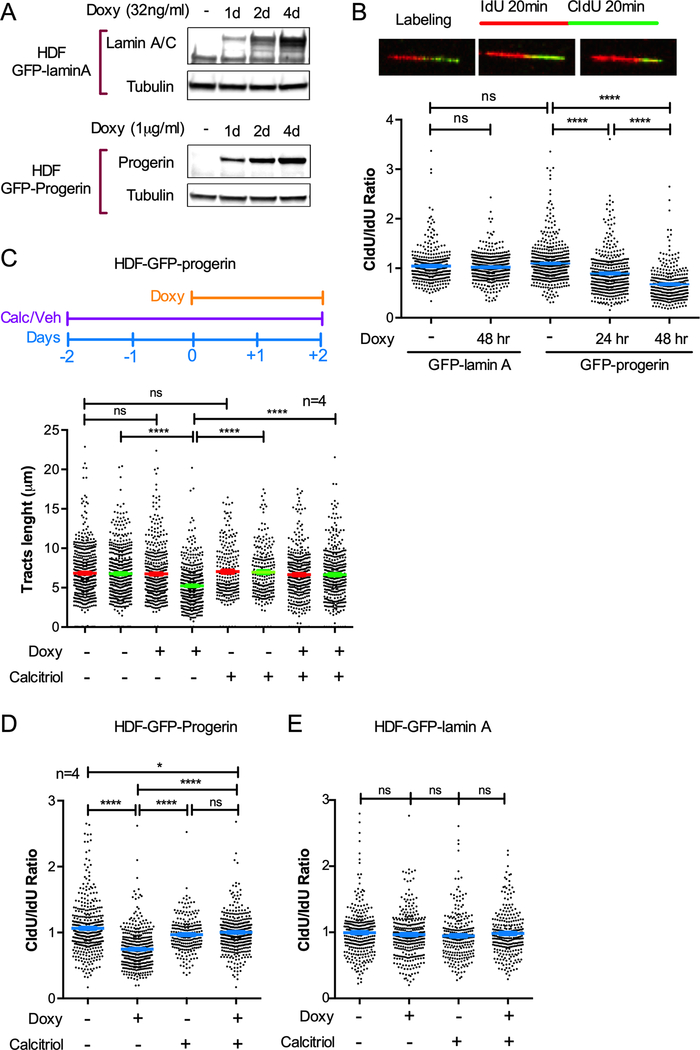
Figure 1. Expression of progerin causes replication fork instability that is rescued by calcitriol.
(A) Immunoblots showing induction of expression of GFP-lamin A or GFP-progerin in human derived fibroblasts (HDF) via treatment with doxycycline (Doxy) for increasing number of days. Lamin A/C antibody shows increasing levels of GFP-lamin A, while endogenous lamin A levels remain constant. β-tubulin is the loading control. (B) Single-molecule replication analysis performed in HDF described in (A). Images show DNA fibers in GFP-progerin cells labeled with IdU 20 min + CldU 20 min as detected by fluorescence confocal microscopy. Left: no Doxy; Central: Doxy 24 hr.; Right: Doxy 48 hr. Tract lengths are measured using ImageJ. Graph shows the tract length ratio CldU/IdU in untreated HDF and Doxy-treated cells for 24 and 48 hr. Note how the ratio CldU/IdU is <1 in GFP-progerin but not in GFP-lamin A cells. Graph shows average ± s.e.m. of 3 biological repeats (3 independent treatments). (C) HDF-GFP-progerin cells were treated with calcitriol (100 nM 1α,25-dihydroxy-vitamin D3) for 2 days prior to induction of GFP-progerin by Doxy. The lengths of red and green tracts under the different conditions are shown. Graph shows average ± s.e.m. of 4 biological repeats (4 independent treatments). Note how green tract shortening in GFP-progerin-expressing cells is rescued by calcitriol. (D) Tract length ratio CldU/IdU in HDF-GFP-progerin cells. (E) CldU/IdU ratio in HDF-GFP-lamin A cells. ~100 fibers measured in each experiment. All DNA fiber assays were performed with the same labeling scheme as in (A), and statistical differences were considered significant if p<0.05.

