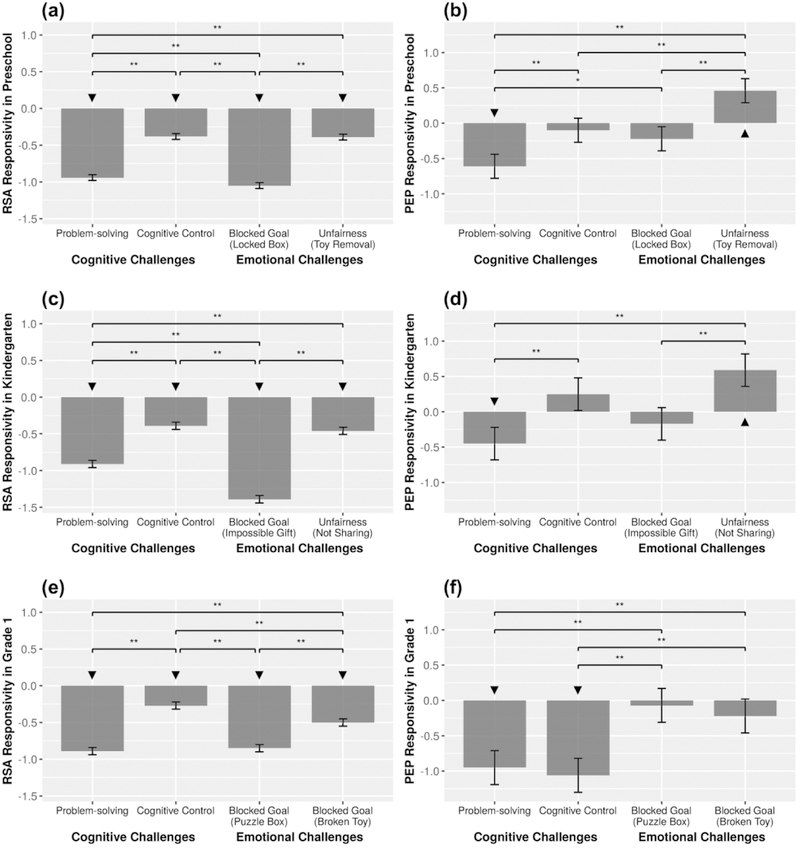
Figure 1.
Results from the HLM hypothesis tests comparing the magnitude of the fixed effects reflecting ANS responsivity toward challenges in preschool. Asterisks (*) indicate the significance level of the chi-square tests comparing fixed effects. *p < .05, **p <.01. Negative RSA responsivity scores reflect RSA withdrawal. Negative PEP responsivity scores reflect PEP shortening (sympathetic activation) and positive PEP responsivity scores reflect PEP lengthening (sympathetic inhibition). “Downward arrow” indicates a significant decrease in ANS responsivity (e.g., RSA withdrawal) and the “upward arrow” indicates significant increase in ANS responsivity (e.g., PEP lengthening). Error bars represent standard errors of the fixed effects.

