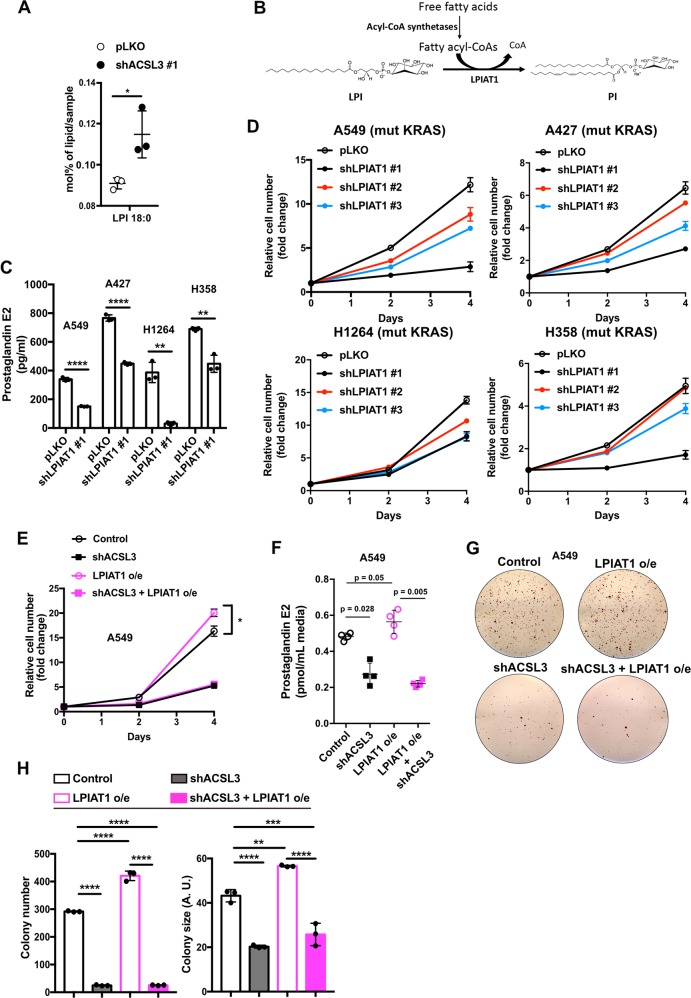
Fig. 2. LPIAT1 requires ACSL3-derived arachidonoyl-CoA for prostaglandin synthesis.
a Lysophosphatidylinositol (LPI) 72 h after ACSL3 knockdown in A549 cells. Cells were transduced with either an empty vector control (pLKO) or an shRNA against ACSL3 (#1), 72 h later lipids were extracted and analyzed by mass spectrometry-based shotgun lipidomics n = 4/group. Data are presented as mean ± SD. b Schematic model for LPIAT1 function in phospholipid remodeling. c PGE2 ELISA assay for A549, A427, H1264, and H358 cell lines. Cells were transduced with either an empty vector control (pLKO) or shRNA against LPIAT1 (shLPIAT1 #1). Cells were transduced, selected with puromycin and plated for PGE2 measurement. 24 h later the media was changed, incubated for additional 24 h and PGE2 production was quantified from the supernatant n = 3/group. Data are presented as mean ± SD. d Relative cell number of A549, A427, H1264, and H358 cell lines transduced with an empty vector control (pLKO) or three different shRNAs against LPIAT1. n = 3/group. Data are presented as mean ± SD. e Relative cell number of A549 cell line transduced with either pLKO.1 hygro + pLenti-GIII-CMV-GFP-2A-Puro (control) or pLKO.1 hygro-shACSL3 #2 + pLenti-GIII-CMV-GFP-2A-Puro (shACSL3) or pLKO.1 hygro + pLenti-GIII-CMV-GFP-2A-Puro-LPIAT1 (LPIAT1 overexpression) or pLKO.1 hygro-shACSL3 #2 + pLenti-GIII-CMV-GFP-2A-Puro-LPIAT1 (shACSL3 + LPIAT1 overexpression) n = 3/group; o/e: overexpression. Data are presented as mean ± SD. f PGE2 quantification from A549 cell line supernatants. Cells were transduced with either pLKO.1 hygro + pLenti-GIII-CMV-GFP-2A-Puro (control) or pLKO.1 hygro-shACSL3 #2 + pLenti-GIII-CMV-GFP-2A-Puro (shACSL3) or pLKO.1 hygro + pLenti-GIII-CMV-GFP-2A-Puro-LPIAT1 (LPIAT1 overexpression) or pLKO.1 hygro-shACSL3 #2 + pLenti-GIII-CMV-GFP-2A-Puro-LPIAT1 (shACSL3 + LPIAT1 overexpression). Cells were transduced, selected with 2 μg/mL puromycin or 150 ng/mL hygromycin and plated for PGE2 measurement. 24 h later the media was changed, incubated for additional 24 h and Supernatants were analyzed by ultra-high performance liquid chromatography with tandem mass spectrometry n = 4/group. Data are presented as mean ± SD. g Representative images of soft agar colony formation assay in A549 cells transduced as in f. h Histograms showing quantification of colony number and size of A549 cells grown in soft agar treated as in f. n = 3/group. AU arbitrary units. Data are presented as mean ± SD. Statistical analyses were done using two-tailed unpaired Student’s t test or one-way ANOVA. *p < 0.05, **p < 0.01, ****p < 0.0001.

