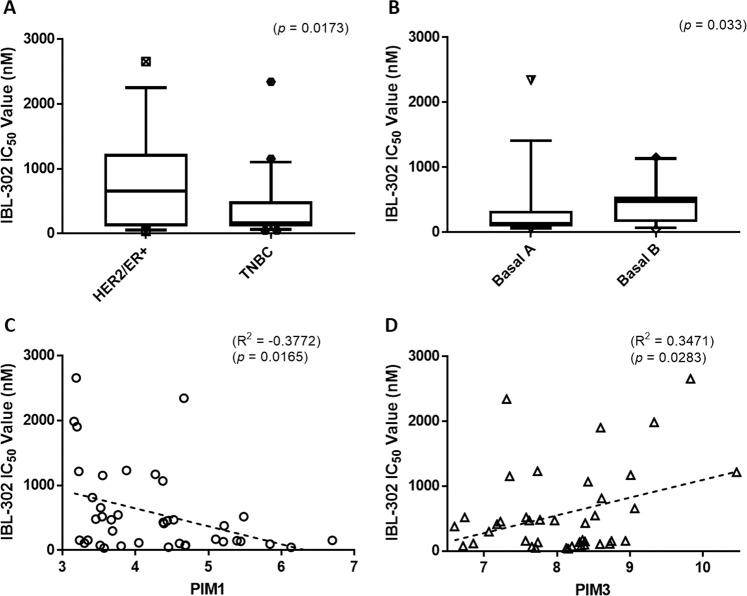
Fig. 2. Using the clinical subtype, molecular subtype and PIM 1/3 expression values of 40 breast cancer cell lines, IBL-302 sensitivity (based on IC50) was examined.
(a) Compares triple-negative versus HER2-amplified/ER+ breast cancer cell lines in terms of IBL-302 IC50 values. (b) Compares Basal A triple-negative with basal B triple-negative breast cancer cell lines in terms of IBL-302 IC50 values. (c) Compares PIM 1 expression across the 40 breast cancer cell lines with IBL-302 IC50 values and (d) compares PIM 3 expression across the 40 breast cancer cell lines with IBL-302 IC50 values.

