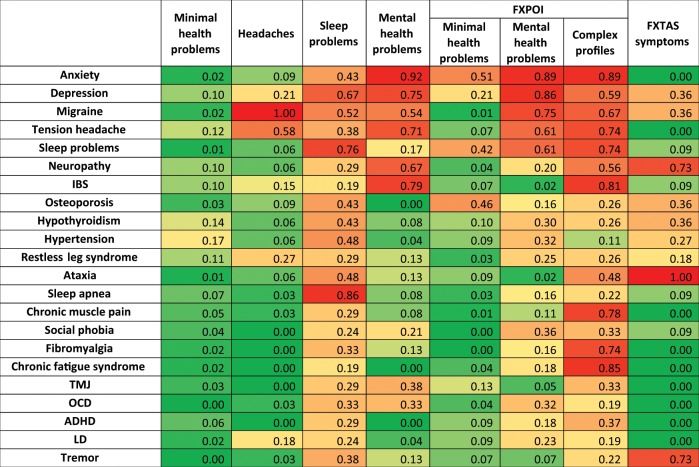
Table 4.
Heat map showing frequencies of reported conditions within each cluster.
Color scale: red indicates increased reporting (either option 1 or 2) of condition within the cluster and green represents decreased reporting of conditions within the cluster.
ADHD attention deficit–hyperactivity disorder, CFS chronic fatigue syndrome, FXTAS fragile X–associated tremor–ataxia syndrome, IBS irritable bowel syndrome, LD learning disability, OCD obsessive compulsive disorder, RLS restless leg syndrome, TMJ temporomandibular joint dysfunction.

