Fig. 2.
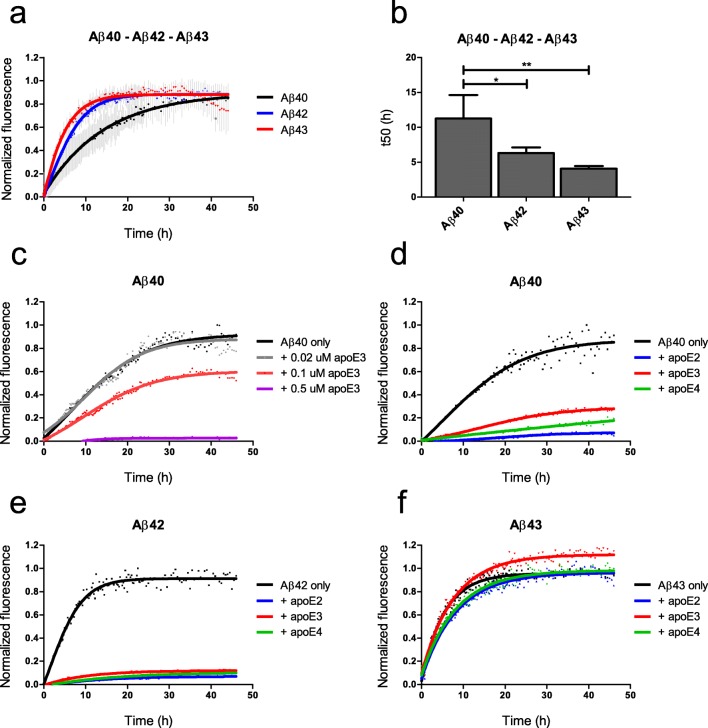
Aggregation kinetics of Aβ. Compared with Aβ42 and Aβ43, Aβ40 aggregated slower (a) and had a significantly higher t50 value, at which ThT fluorescence reached 50% of the maximum amplitude (b). ApoE3 inhibited Aβ40 aggregation in a concentration-dependent manner (c). Aggregation of Aβ40 (d) and Aβ42 (e) was inhibited by the addition of 0.1 μM apoE2, apoE3, or apoE4. Aβ43 aggregation was not affected by the addition of 0.1 μM of any apoE isoform (f). Aβ concentrations in all experiments were 10 μM. a, b Data represent mean (sd) of n = 4 experiments performed. c–f Representative data of n = 3 experiments. The t50 times were analyzed by ANOVA, followed by Bonferroni’s post hoc testing. *p < 0.05 and **p < 0.01

