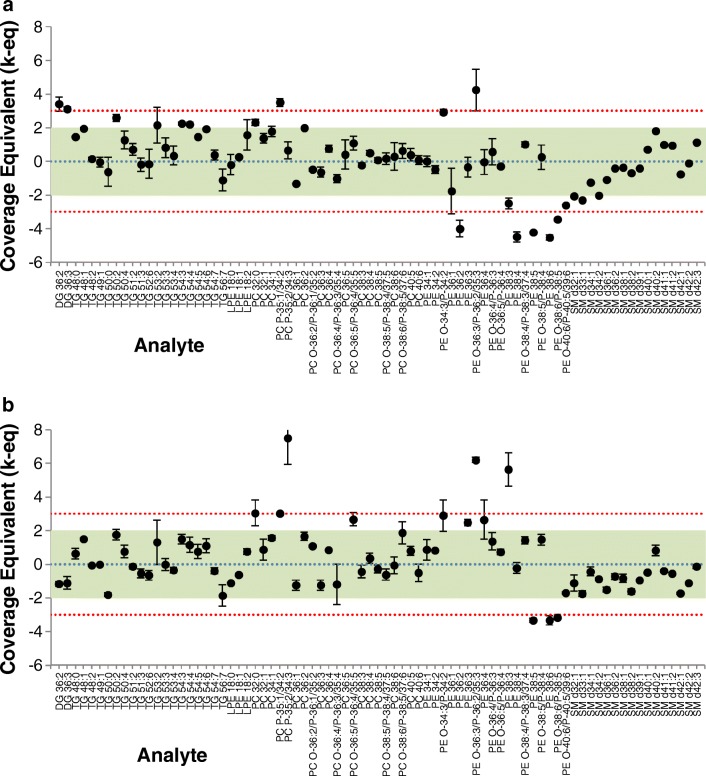
Fig. 6.
Accuracy assessment for SRM 1950 - “Metabolites in Frozen Human Plasma.” Values are presented as normalized coverage equivalents at the mean (dots) and stdev (error bars, N = 2) of measurements, overlaid onto the consensus mean value (blue line) and uncertainty (95% coverage, green region; 99% coverage, red region). a Fractionated with SFC. b Non-fractionated full extract. See ESM Tables S3 and S4 for detailed results. Graphic is produced with LipidQC [58]

