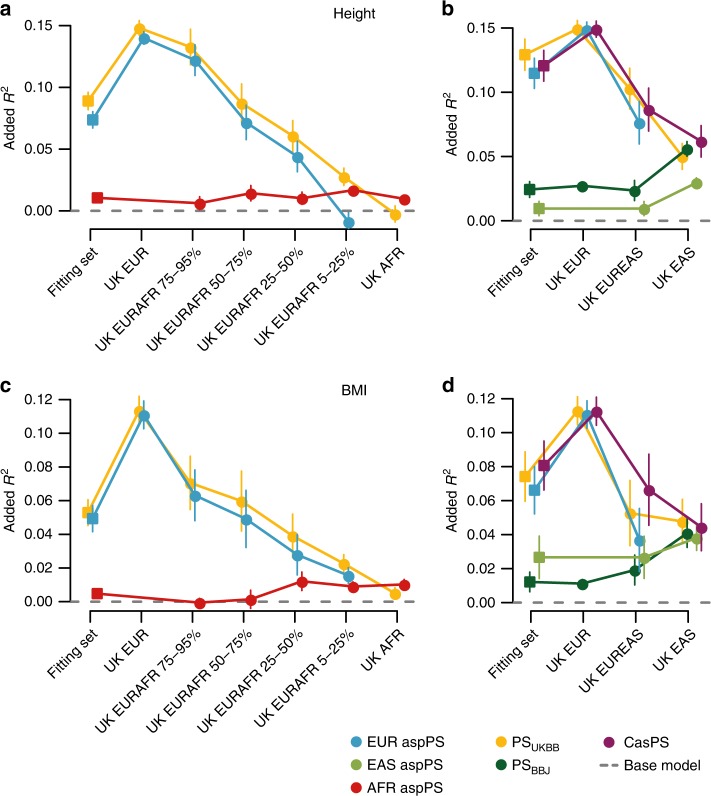
Fig. 5. Predictivity in admixed genomes.
Each plot shows the improvement in R2 when adding a PS to the base, non-genetic model. The line color depicts which PS configuration has been used: traditional total PS (PSUKBB or PSBBJ according to the Biobank of origin), partial ancestry specific PSs or combined ancestry specific PS. Dots represent the realized R2 improvement in each set without resampling, while bars represent standard deviation derived from n=5000 bootstrap replications. a Added R2 for height in UKBB samples with admixed African and European ancestry, no casPS was available. b Added R2 for height in UKBB samples with admixed East Asian and European ancestry. c Added R2 for BMI in UKBB samples with admixed African and European ancestry; no casPS was available. d Added R2 for BMI in UKBB samples with admixed East Asian and European ancestry. EUR indicates european descent, EAS east asian descent, AFR african descent; combinations indicate admixed samples.

