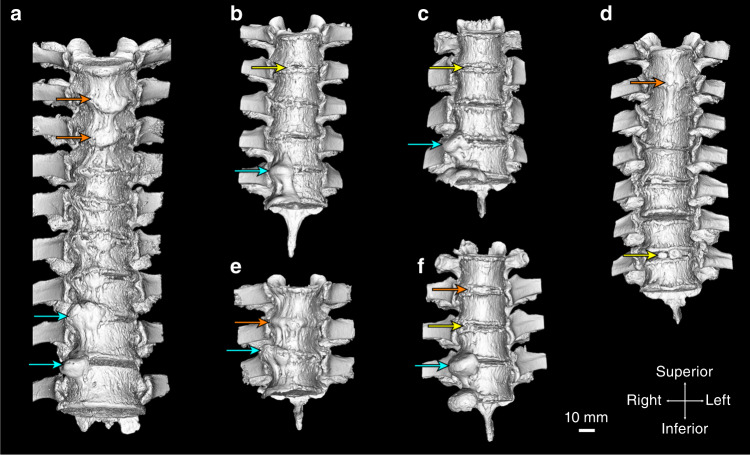
Fig. 1.
Three-dimensional isosurface renderings (anterior view) derived from microcomputed tomography (µCT) showing mineralized tissues (>310 Hounsfield units) of the spines included in the study. a 85-year-old male, thoracic vertebrae 4–11. b 77-year-old male, thoracic vertebrae 3–7. c 88-year-old male, thoracic vertebrae 7–9. d 72-year-old male, thoracic vertebrae 3–9. e 78-year-old male, thoracic vertebrae 4–6. f 86-year-old female, thoracic vertebrae 4–7. Arrows indicate the level of the intervertebral disc of the specific motion segments included in the study; yellow arrows—discontinous-patchy presentation, orange arrows—vertical presentation, and cyan arrows—horizontal presentation. The scale bar represents 10 mm

