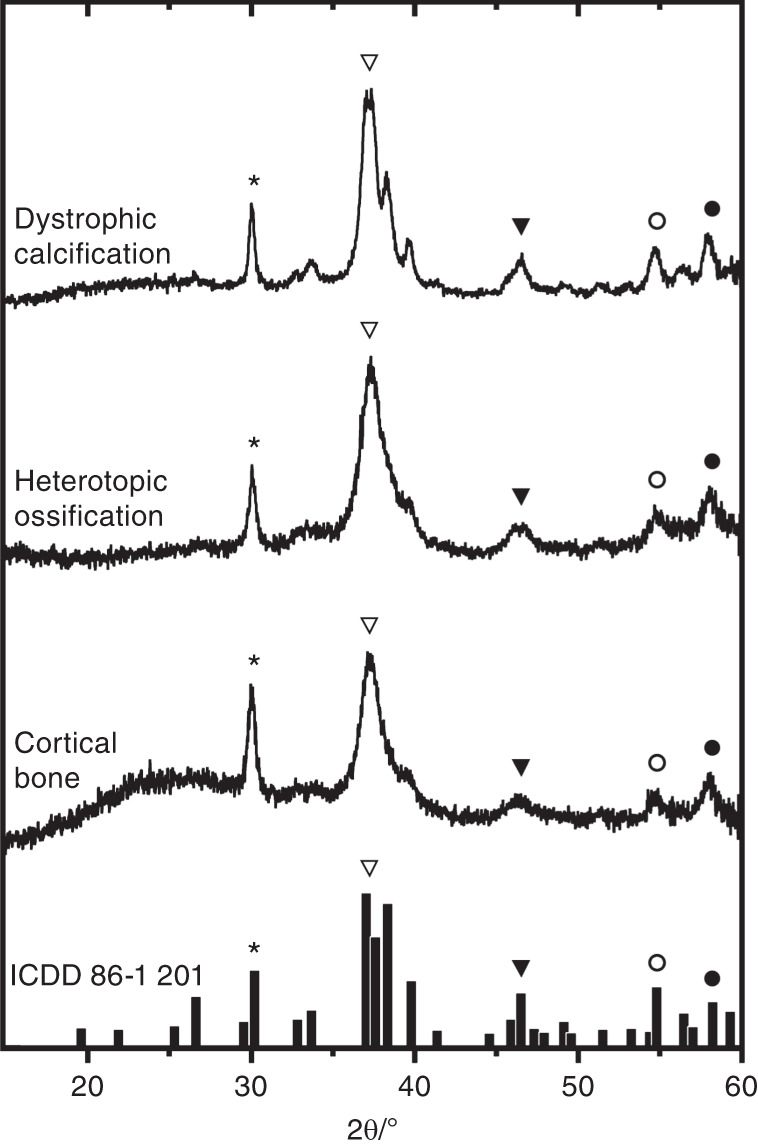
Fig. 5.

X-ray diffraction patterns from regions of ectopic mineralization associated with DISH. Shown are representative X-ray diffraction patterns from individual regions within sites of dystrophic calcification (n = 2 spines; 2 regions per deposit), heterotopic ossification (n = 3 spines; 2–4 regions per deposit), and unaffected cortical bone (3 spines; 1 region per segment) displayed in a stack plot. The results were matched to calcium-deficient hydroxyapatite [Ca8.8(PO4)6(OH)1.92] from the International Centre for Diffraction Data (powder diffraction file: 86–1 201), as indicated by the bar plot at the bottom and symbols
