Fig. 6.
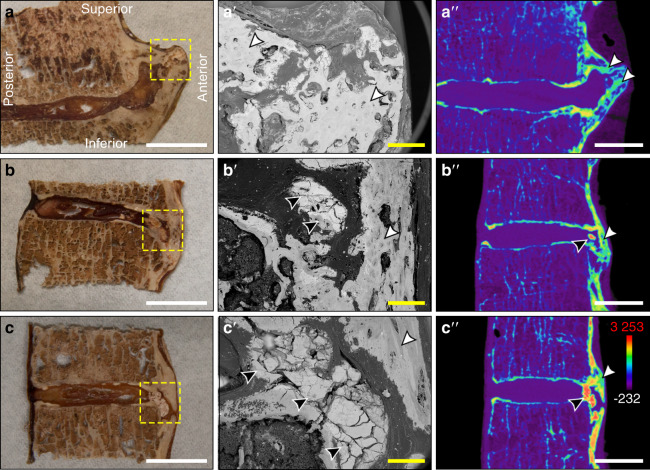
Characterization of the gross morphology and radiodensities of ectopic mineralizations associated with DISH. a–aʹʹ Thoracic segment T9-10 from an 85-year-old male with heterotopic ossification (Fig. 1a), b–bʹʹ thoracic segment T3-4 from a 72-year-old male with dystrophic calcification (Fig. 1f), and c–cʹʹ thoracic segment T3-4 from an 85-year-old male with dystrophic calcification (Fig. 1a). a–c The gross appearance of desiccated tissues with yellow dotted lines showing regions analyzed by scanning electron microscopy; white scale bars represent 10 mm. aʹ–cʹ Corresponding scanning electron microscopy images; yellow scale bars represent 1 mm. aʹʹ–cʹʹ Pseudocolored radiodensity maps from matched µCT slices. Colors represent various radiodensities: purple (−232 to 310 Hounsfield units) corresponds to soft tissues; blue–green (310–2 750 Hounsfield units) corresponds to normal bone; and orange–red (2 750–3 253 Hounsfield units) corresponds to mineralizations exceeding the density of normal cortical bone. Topographical analysis of tissue sections by scanning electron microscopy highlighted the uniform, amorphous appearance of dystrophic calcifications (black arrowheads) within the intervertebral disc, which are distinct in appearance from adjacent ossifications (white arrowhead); white scale bars represent 10 mm. All images are oriented as shown in a

