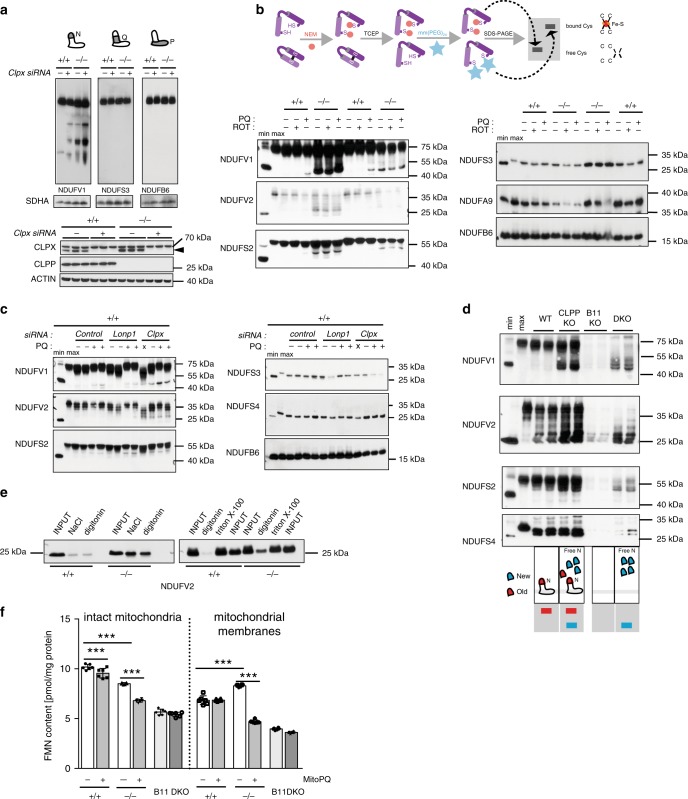
Fig. 4. Accumulation of modified N-module causes respiratory chain deficiency.
a Upper panel: BN-PAGE followed by western blot analysis of CI profiles upon the siRNA-mediated Clpx knockdown in wild type (+/+) and CLPP-deficient (−/−) MEFs. Lower panel: western blot analysis of CLPP and CPLX levels upon siRNA-mediated knockdown of Clpx. (n = 4). b–d Inverse-shift analysis of CI subunits in wild type (+/+) or CLPP-deficient (−/−) MEFs investigated by western blot. The NEM-mediated stabilization of the free thiols and the subsequent mmPEG24-modification after reductant treatment (TCEP) of previously blocked thiols allowed the mass-shift differentiation within the protein pool. (min = free thiols; max = bound thiols). b MEFs were pre-incubated in the absence or presence of ROS-inducing rotenone (ROT; 200 μM) or paraquat (PQ; 1 mM). Each genotype is represented by two independent clones (n = 3); c Analysis performed upon 48 h siRNA-mediated knockdown of Lonp1 or Clpx (n = 2); d Upper panel: inverse-shift analysis of the individual CI subunits in wild type (WT), CLPP-deficient (CLPP KO), NDUFB11-deficient (B11 KO), and CLPP/NDUFB11 double-deficient (DKO) MEFs. Lower panel: schematic representation of the experimental outcome. e Native-immunoprecipitation efficiency of NDUFV2 subunit from wild type (+/+) and CLPP-deficient (−/−) heart mitochondria using various solubilization conditions: NaCl–salt extraction; digitonin–lysis in 1% digitonin (w/v); Triton-X-100–lysis in 1% Triton-X-100 (w/v) (n = 2). a–e Antibodies used were raised against proteins indicated in the Figure, with putative CLPP substrates shown in bold. “n” represents number of biologically independent experiments. Individual lanes represent biological replicates. f FMN content in intact mitochondria and permeabilized mitochondrial membranes from wild type (WT), CLPP-deficient (CLPP KO), NDUFB11-deficient (B11 KO), and CLPP/NDUFB11 double-deficient (DKO) MEFs. Cells were incubated for 16 h in the presence or absence of mitoPQ (5 μM) prior to mitochondria isolation. Mitochondria from different experiments (n = 3–6) were pooled and further preceded as technical replicates (n = 6). Flavin content was determined with fluorescence record (at excitation/emission 470/525 nm), and calculated according to calibration with FMN standards. Bars represent mean ± SD (***p < 0.001). Two-way ANOVA followed by Tukey’s multiple comparisons post-test was used to determine the level of statistical difference.

