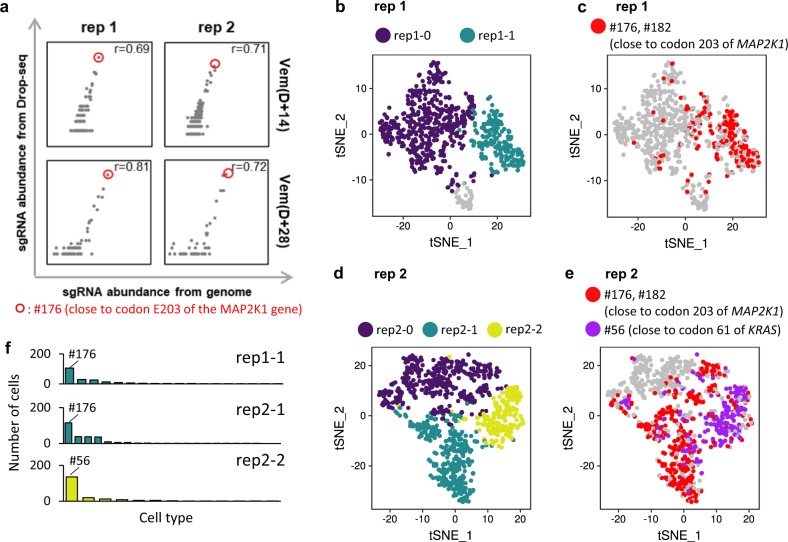
Fig. 3. Analysis of abundance and clusters in scRNA-seq data.
a Concordance of sgRNA abundance from Drop-seq data and genomic data for each replication and condition. The #176 sgRNA, which potentially introduces a known mutation (E203K), is marked by a red circle, and the Pearson correlation coefficient is shown in the upper right corner of the plot. b, c t-SNE visualization of D + 28 cells (b) and distribution of #176 sgRNA-containing cells (c) in replicate 1. d, e t-SNE visualization of D + 28 cells (d), distribution of #176 and #56 sgRNA-containing cells (e) in replicate 2. f Distribution of sgRNAs for rep1-1, rep2-1, and rep2-2.

