Figure 1.
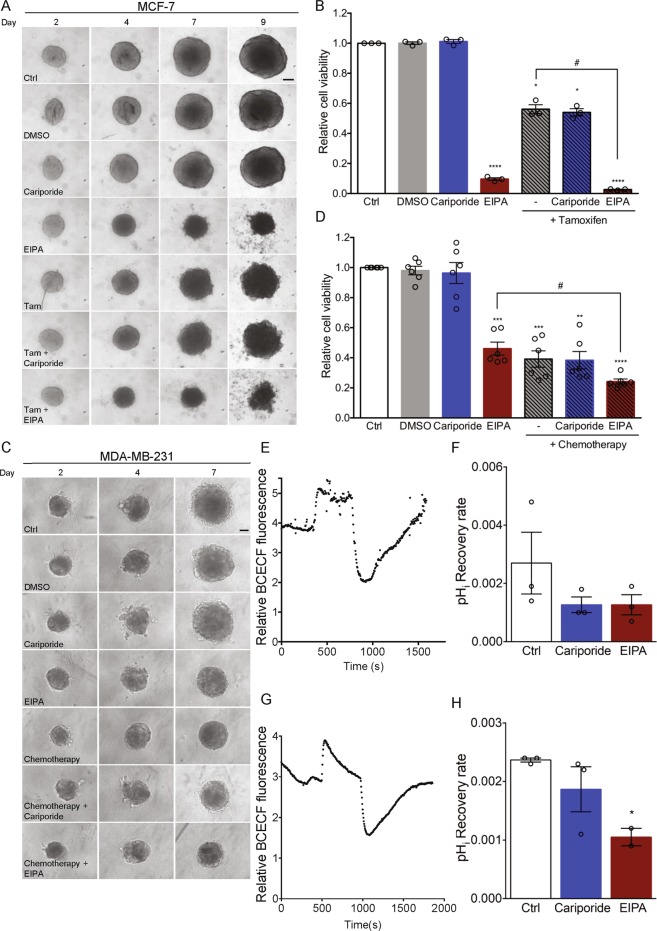
EIPA, but not cariporide, potently reduces viability of MCF-7 and MDA-MB-231 spheroids. MCF-7 and MDA-MB-231 spheroids were grown for 7–9 days. Spheroids were treated simultaneously with NHE1-inhibitors (cariporide (10 µM) or EIPA (10 µM)), breast cancer subtype specific anti-cancer therapy (tamoxifen (Tam, 2 µM) or chemotherapy (Cisplatin (18.75 nM), Doxorubicin (18.75 nM) and 5-FU (0.0625 nM)) or a combination thereof as indicated, on day 2 and 4 (MDA-MB-231) or 2, 4 and 7 (MCF-7). DMSO served as vehicle for the anti-cancer therapy. Light microscopic images of spheroids were acquired on day 2, 4, 7 (MDA-MB-231) and 9 (MCF-7). (A,C) Representative images of MCF-7 and MDA-MB-231 spheroids, respectively. 3–6 n. Scale bar: 100 µm. (B,D) Cell viability of MCF-7 (day 9) (B) and MDA-MB-231 (day 7) (D) spheroids, respectively. One-way ANOVA test with Tukey’s multiple comparisons post-test was used to determine statistically significant differences between treatment groups. * and # denotes significant differences between the treatment condition relative to DMSO and between two treatment conditions, respectively. For panel 1B, the p-value is 0.0116 and 0.0147 for control vs. tamoxifen + cariporide and tamoxifen vs. tamoxifen + EIPA, respectively, while for panel 1D the p-value is 0.0011 and 0.0143 for control vs. chemotherapy + cariporide and for EIPA vs. chemotherapy + EIPA, respectively. Error bars denote SEM. 3–6 n. (E,G) Representative traces demonstrating BCECF-fluorescence as a function of time during pHi recovery of MCF-7 (day 4) (E) and MDA-MB-231 (day 4) (G) spheroids after NH4Cl pre-pulse. Fluorescence is depicted as the 485/440 nm ratio of BCECF intensity. 2–4 n (F,H) Quantification of pHi recovery rate of MCF-7 (p-value = 0.343 for control vs. both cariporide and EIPA) (F) and MDA-MB-231 (p-value = 0.348 for control vs. cariporide, and 0.0461 for control vs. EIPA) (H) spheroids determined as the slope of the first 120 s after maximum acidification. Error bars denote SEM. 2–4 n. Statistical significance determined using a one-way ANOVA test with Tukey’s multiple comparisons test. 2–3 n.

