Figure 3.
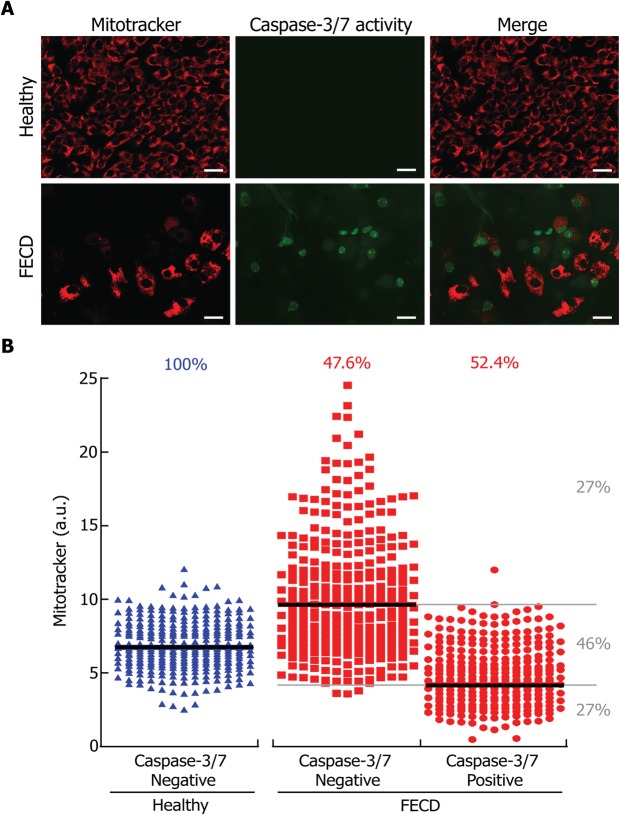
Cell death is linked to mitochondrial mass depletion in FECD CEC. (A) A marker of cell death by apoptosis (caspase-3/7 activity; green) was used in conjunction with the mitochondrial mass marker (mitotracker; red) in healthy and FECD explants. (B) Mitochondrial and caspase-3/7 signals were quantified in healthy (blue) and FECD (red) explants and plotted. Each dot represents a single cell. No caspase-3/7 signal was detected in healthy explants. Caspase-3/7 negative and positive cells composed 48% and 52% of the FECD cells, respectively. The median mitochondrial mass was higher in caspase-3/7 negative cells than in caspase-3 positive cells. FECD CECs with mitochondrial mass ranging between Caspase-3/7 positive and negative medians composed 46% of the FECD cellular population. These cells are referred to as containing a “Normal mitochondrial level”, which happened to be very similar to that of healthy cells. Twenty seven percent of the Caspase-3/7 negative FECD cells were above the median mitochondrial mass level and are therefore referred to as containing a “High mitochondrial level”. On the other hand, 27% of the caspase-3/7 positive FECD cells were below the median mitochondrial mass level and are therefore referred to as containing a “Low mitochondrial level”. Scale bar = 40 μm. Experiments were performed with 3 different explants from Healthy (900 cells analyzed, N = 3) and 3 FECD patients (846 cells analyzed, N = 3).

