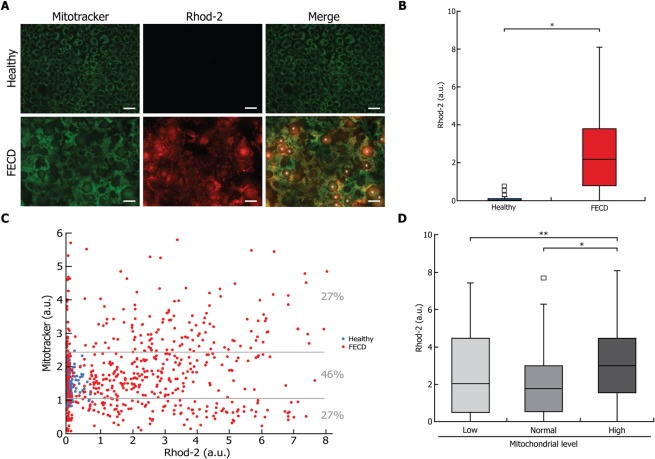
Figure 5.
Higher mitochondrial calcium is found in FECD cells. (A) A marker of intra-mitochondrial calcium (Rhod-2; red) was measured in conjunction with mitochondrial mass marker (mitotracker; green) in healthy and FECD explants. Rhod-2 labelling allows the observation that CECs were much larger in the FECD than in the healthy explant and numerous guttae (star) are seen, disorganizing the architecture of the endothelial mosaic. (B) Quantification of intra-mitochondrial calcium showed a significantly higher levels of calcium in the FECD CECs, with no detectable level in healthy CECs. (C) Rhod-2 and mitotracker signal levels were plotted, each dot representing a single CEC (blue for healthy cells and red for FECD). A weak correlation was observed (R2 = 0.020; p < 0.001). (D) Quantification of Rhod-2 in FECD CEC populations according to their mitotracker mass, i.e. low, normal and high mitochondrial level categories as depicted in Fig. 3, revealed that only the category with a high mitochondrial mass had a calcium level significantly higher than that of the other two categories. Scale bar = 40 μm. Experiments were performed with 3 different explants from Healthy (800 cells analyzed, N = 3) and 4 FECD patients (710 cells analyzed, N = 4). *p < 0.01 and **p < 0.001.

