
Figure 1.
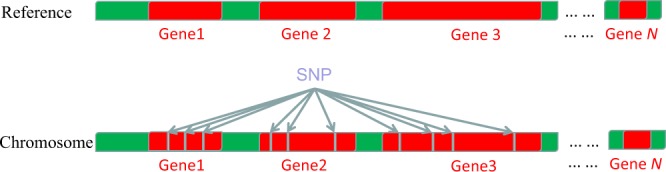
A conceptual diagram showing the distribution of SNPs on a chromosome with reference to the reference chromosome: the chromosome is similar to an ecological community, and the number of SNPs on a gene locus is similar to the species abundance in an ecological community. For example, there are three SNPs on the locus of gene-1, assuming the total SNPs on the chromosome is N (or 10 displayed with the first 3 genes displayed), then the relative SNP abundance for gene-1 is equal to 3/N (or 3/10 = 0.3 with the 3 genes displayed). Similarly, p2, p3, … can be computed. When the relative abundances of SNPs are available, the diversity (Hill numbers) can be computed based on the diversity definitions [Eqs. (2–15)]. The R-codes computing alpha-diversity, beta-diversity (including similarity) profiles are provided in the OSI.