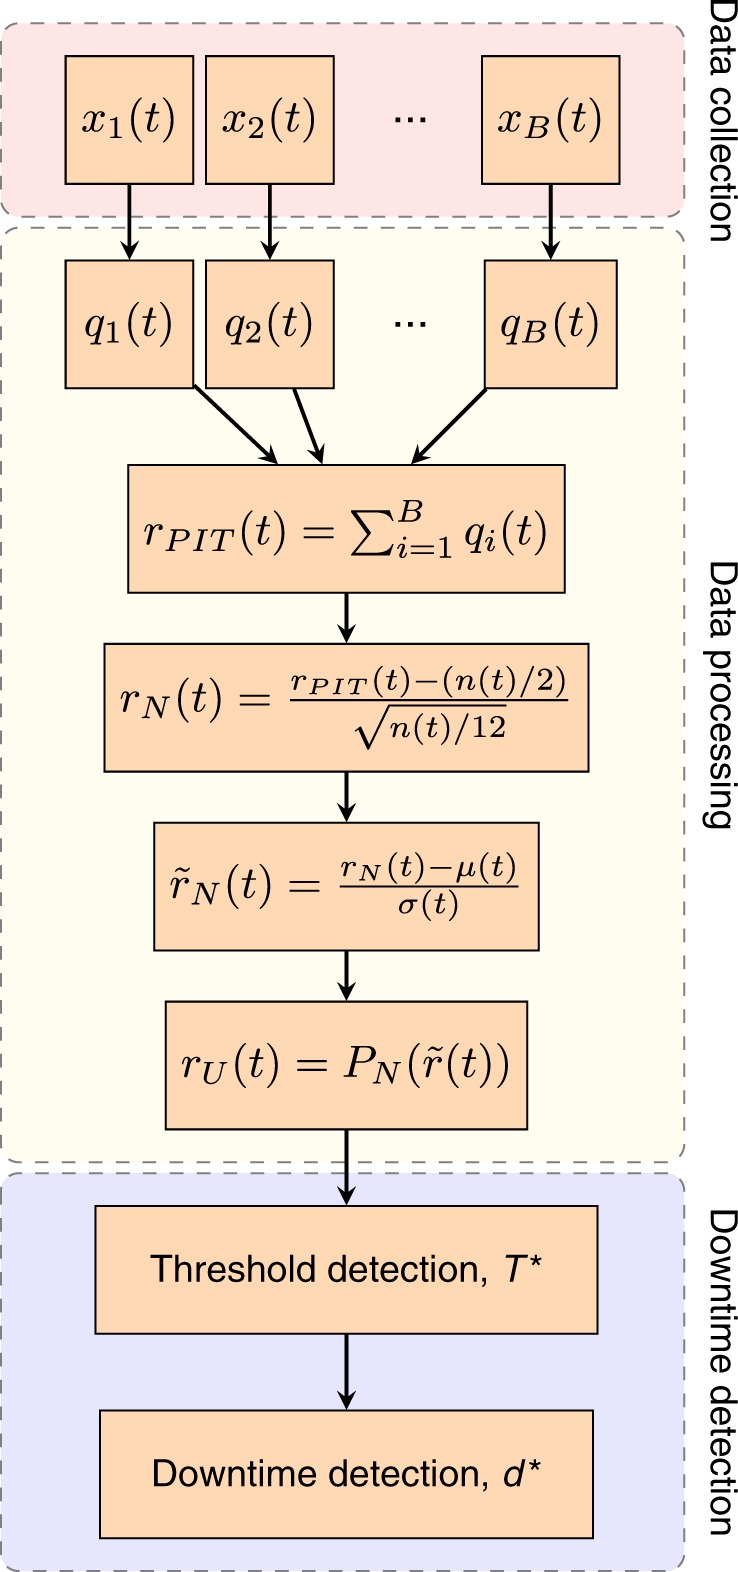
Fig. 2. Schematic for the proposed framework to detect downtime of small businesses after natural hazard events.

Data collection: The time series of posting activity for each business is collected. Data processing: The ‘mid-quantiles' of each series are computed to determine transformed individual time series for each business . The aggregate time series is transformed by a shifting and rescaling to have mean zero and variance one (). The probability integral transform is then applied to form a final transformed time series for the level of activity in the region. Downtime detection: Threshold is found using the elbow method to identify anomalous events. For a given event, the downtime length, is determined.
