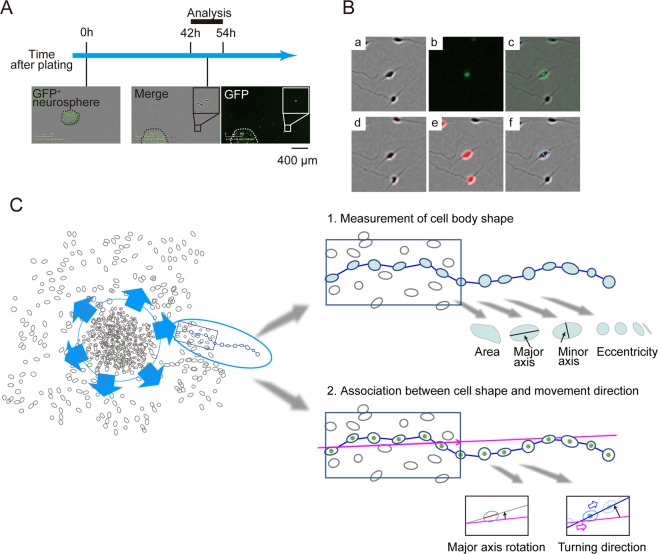
Figure 1.
Automated method for identifying cell shape and position. (A) Experimental scheme. Cell aggregates (neurosphere) containing GFP-positive (GFP+) cells were plated onto Matrigel-coated dishes. Images of the GFP and phase-contrast optics from 42 to 54 h were analyzed. Dashed lines represent the edges of the aggregates. Insets show magnified images of the cells that migrated out from the aggregates. (B) Representative example of the automated detection of the cell body area. Images in (a–f) are from the same frame taken at 42 h. (a) Phase-contrast image. (b) Nuclear GFP signal. (c) Merged image of the phase-contrast image and GFP signal. (d) Edge detection using a sobel filter (red). (e) Selected area of a cell body (red). (f) Fitted ellipse and its minor axis of the central cell (pale blue) and the major axis (red). (C) Analysis strategy of cell shape and migration behaviors. We captured the time lapse images of migrating neurons in vitro and tracked a single cell by GFP signal (Left). In step 1 (Right upper), from the video image of migrating cells, we measured the size of cell-body areas, major/minor axis and eccentricity of the fitted ellipses. These features related to cell-shape were then compared between HC and RELN-del cells (Fig. 2). In step 2 (Right lower), we calculated the projected path (pink line) of each cell by using the first half of positional data. Using the projected path as the reference path, we created an evaluation method to test if the major axis rotation was associated with the movement direction. Then, we compared between HC and RELN-del cells (Figs. 3–5).

