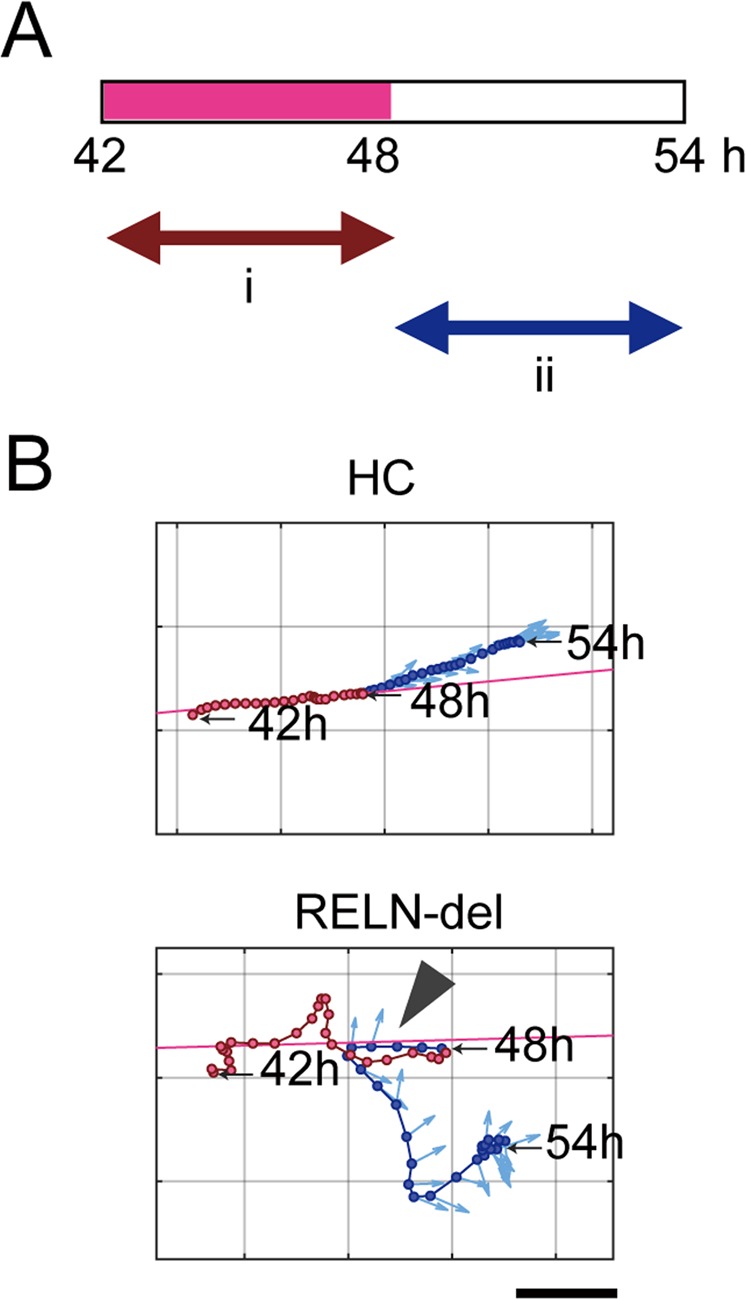
Figure 3.

Time-lapse analysis of migrating iPSC-derived dopaminergic neurons. (A) Scheme of time-lapse analysis. Positional data of cells (GFP) in the first half (i) (pink interval in the time bar) was used to define the projected path. (B) Examples of the trajectories of HC and RELN-del cells. The pink line in each plot denotes the projected path. The red circles indicate cells at 42–47.75 h (i), whereas blue circles indicate cells at 48–54 h (ii). Pale blue arrows denote the cell major axis orientation. Arrowhead indicates the point at which the cell turned to the opposite direction. Time points at 42, 48, and 54 h are noted. Scale bar represents 60 μm.
