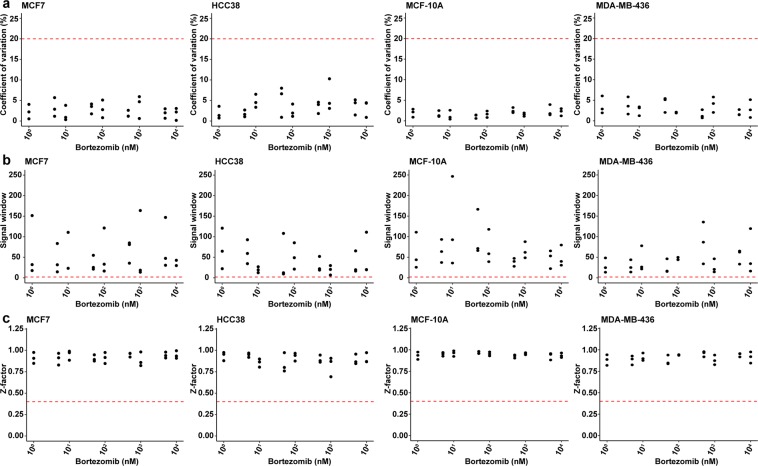
Figure 5.
Validation of the optimized resazurin reduction assay using assay quality control metrics (coefficient of variation (CV), signal window (SW), and Z-factor (Z)). (a) CV, (b) SW, and (c) Z were determined using cell viability data for MCF7, HCC38, MCF-10A, and MDA-MB-436 breast cancer cells treated with bortezomib for 24 hours. Three independent experiments were performed in triplicate. The red dotted lines depict cutoffs set at CV < 20%, SW > 2, and Z > 0.4. The scatterplots were generated using ggplot2 (version 3.2.1) in R51.

