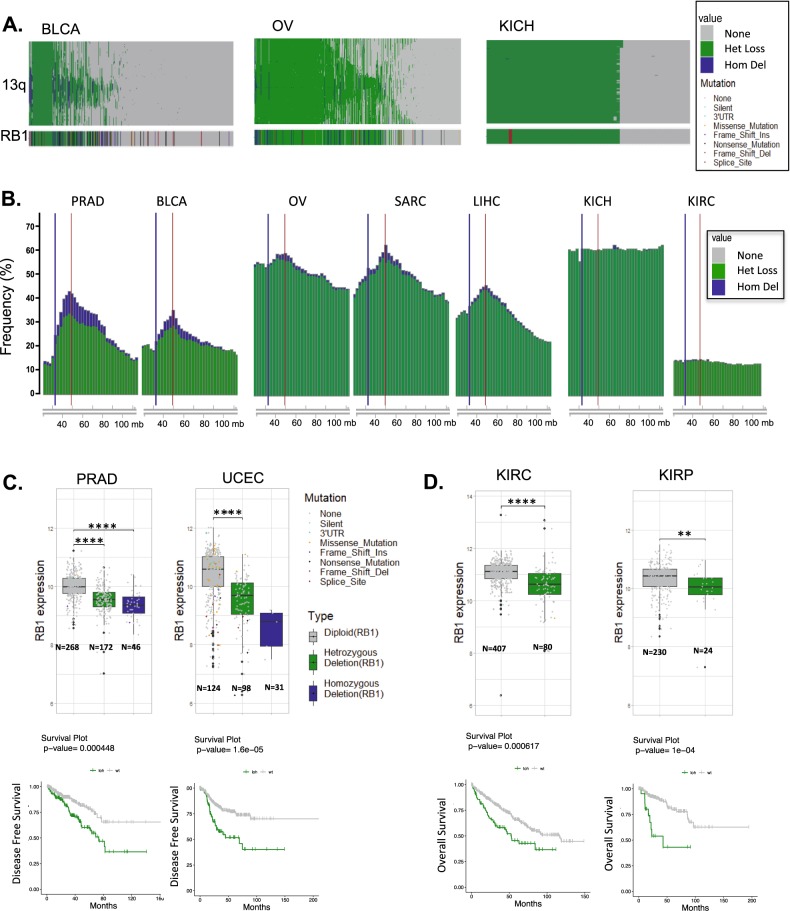
Fig. 2. Perturbations of RB1 locus in cancer.
a Copy number analysis of single copy loss (green) and deletion (blue) of genes in cis along chromosome arm 13q. Data is shown for BLCA, OV, and KICH, the RB1 gene data is shown for reference. b Frequency plots of single copy (green) and deletion (blue) along 13q are shown for the indicated tumor types. The red line denotes the position of RB1 and blue line denotes the position of BRCA2 on chromosome 13q (chromosomal location by nucleotide number is shown). c Analysis of RB1 expression in tumors exhibiting diploid, heterozygous loss, or deletion of the RB1 locus in PRAD and UCEC (Student’s t-test two sided: **p < 0.01, ***p < 0.001,****p < 0.0001). Kaplan–Meier analysis of disease free survival by diploid vs. heterozygous loss of the RB1 locus. Statistical analysis is by log-rank approach. d Analysis of RB1 expression in tumors exhibiting diploid and heterozygous loss of the RB1 locus KIRP and KIRC (Student’s t-test two sided: **p < 0.01, ***p < 0.001). Kaplan–Meier analysis of overall survival stratified by diploid vs. heterozygous loss of RB1 locus. Statistical analysis is by log-rank approach.

