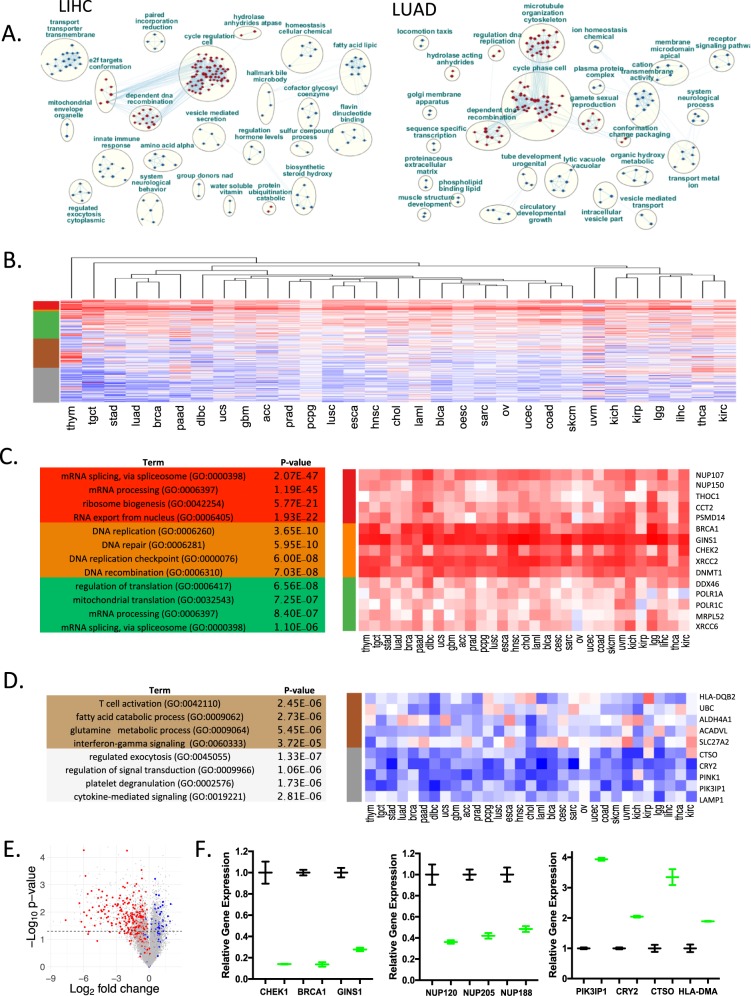
Fig. 5. Defining pathway features beyond cell cycle.
a To define features beyond cell cycle control bootstrapping was performed to define genes that were positively and inversely correlated with the CDK4/6-RB integrated signature. Ranked gene set enrichment coupled with reactome pathway analysis generated key nodes of regulation for each tumor types. b K-means clustering of the correlation coefficients yielded three predominantly positively correlated clusters, and two inversely correlated clusters. c Gene ontology and transcription factor enrichment analysis for the genes in the positively correlated clusters was performed in ENRICHR. Top enriched gene ontologies and transcription factor binding sites are shown. Heatmap showing selected genes from each of the clusters. d Gene ontology and transcription factor enrichment analysis for the genes in the negatively correlated clusters was performed in ENRICHR. Top enriched gene ontologies and transcription factor binding sites are shown. Heatmap showing selected genes from each of the clusters. e Relationship of correlated genes for breast cancer relative to gene expression analysis from MCF7 cells treated with CDK4/6 inhibitors (red = positively correlated, blue = negatively correlated. f Expression levels of select genes in the positively and negatively correlated expression groups in DMSO control (black) or palbociclib treated (green) groups. The mean and standard deviation of the gene expression are shown. Statistical analysis was determined by Student’s t-test: CHEK1 p = 0.014, BRCA1 p = 0.002, GINS1 p = 0.004, NUP120 p = 0.02, NUP205 p = 0.009, NUP188 p = 0.019 PIK3IP1 p < 0.001, CRY2 p = 0.002, CTO p = 0.014 HLA-DMA p = 0.019.

