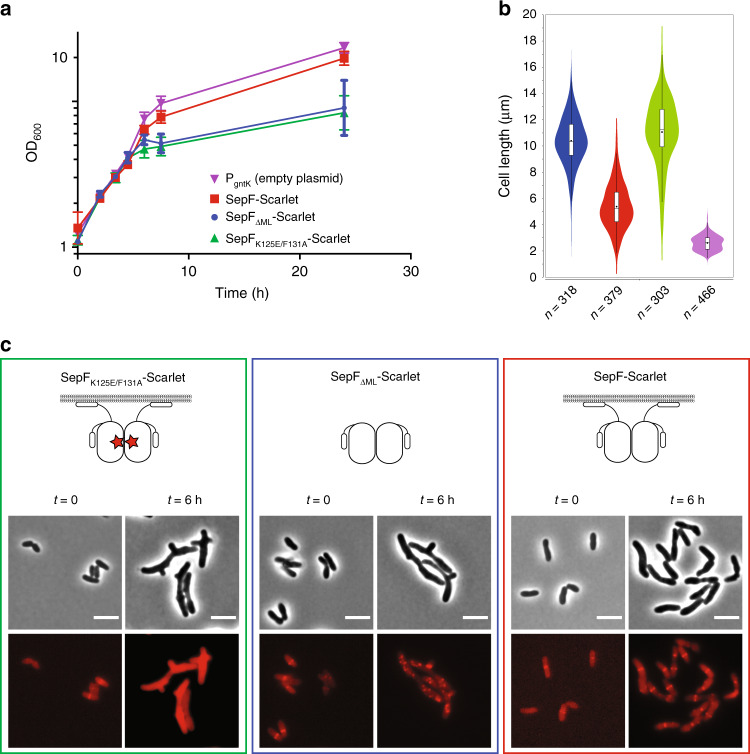
Fig. 3. Complementation and localization of SepF mutants in the Pino-sepF strain.
a Growth curves of SepF-Scarlet (red), SepFΔML-Scarlet (blue), SepFK125E/F131A-Scarlet (green) expressed in the Pino-sepF-PgntK background in 1% myo-inositol plus 1% gluconate and Pino-sepF-PgntK strain in 0% myo-inositol plus 1% gluconate (purple). Error bars represent the mean ± SD. b Violin plot showing the distribution of cell length at time point 6 h after myo-inositol and gluconate addition for the strains corresponding to the growth curve (same color code). The number of cells used in the analyses (n) is indicated below each violin representation. The box indicates the 25th to the 75th percentile and the whiskers indicate the 95% confidence interval. The mean and the median are indicated with a dot and a line in the box, respectively. c Representative images in phase contrast (upper row) and Scarlet fluorescent signal (lower row) of the complemented strains of a. t = 0 corresponds to the strains before depletion by myo-inositol and induction of exogenous PgntK controlled constructs by gluconate. Western blots of whole-cell extracts from the above strains during depletion, as well as triplicate analyses for the distribution of cell length at time points 6 h are shown in Supplementary Fig. 11. The data shown are representative of experiments made independently in triplicate. Scale bars = 5 μm. Source data are provided as a Source Data file.

