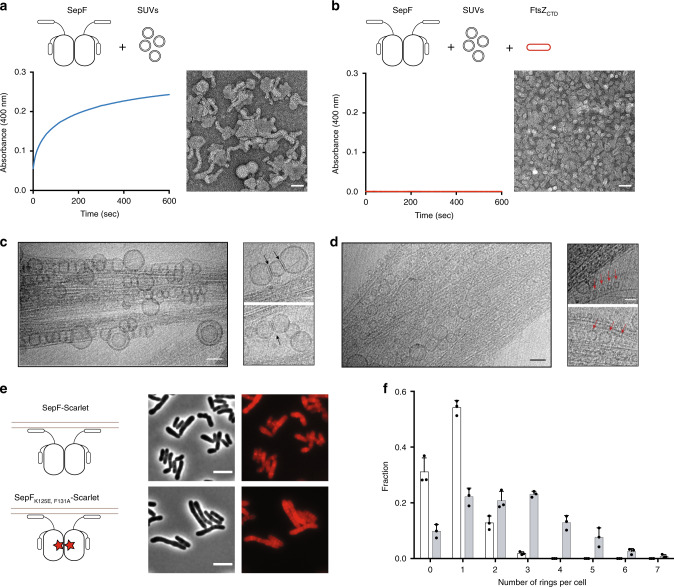
Fig. 5. SepF oligomerization upon lipid membrane-binding and reversal by FtsZ.
a Polymerization assay and negatively stained EM images of the end-point of the assay for SepF in the presence of SUVs. Scale bar: 50 nm. b Idem for SepF in the presence of SUVs + FtsZCTD. Scale bar: 50 nm. c Cryo-EM images of the ternary complex full-length FtsZ-GTP + SepF + SUVs. A bundle of FtsZ filaments is decorated by tubulated lipid vesicles, mostly found on the periphery of the bundles. The smaller panels show two examples of tubulated lipid vesicles, where black arrows indicate the putative SepF rings. Scale bars in large and small panels, respectively: 50 and 30 nm. d In the central regions of the bundles, several small, non-tubulated, vesicles are in close contact with FtsZ filaments. Red arrows indicate a few examples of these vesicles in the right panels. Scale bars in large and small panels, respectively: 50 and 30 nm. e Phase contrast (left columns) and Scarlet fluorescent signal (right column) images show the phenotypic differences observed upon overexpression of SepF-Scarlet (top) and SepFK125E/F131A-Scarlet (bottom) in the WT strain, where endogenous SepF is present. Western blots of whole-cell extracts from the above strains as well as triplicate analyses for the distribution of cell length are shown in Supplementary Fig. 19. Scale bars = 5 μm. f Frequency histogram indicating the number of ring-like structures per cell for SepF-Scarlet (white) and SepFK125A/F131A-Scarlet (gray). The frequencies were calculated from n cells imaged from three independent experiments for each strain (For SepF-Scarlet, n = 423, 471, and 477; and for SepFK125A/F131A-Scarlet, n = 336, 353, and 392). The bars, with data points overlapping, represent the mean ± SD. Source data are provided as a Source Data file. All data shown are representative of experiments made independently in triplicate.

