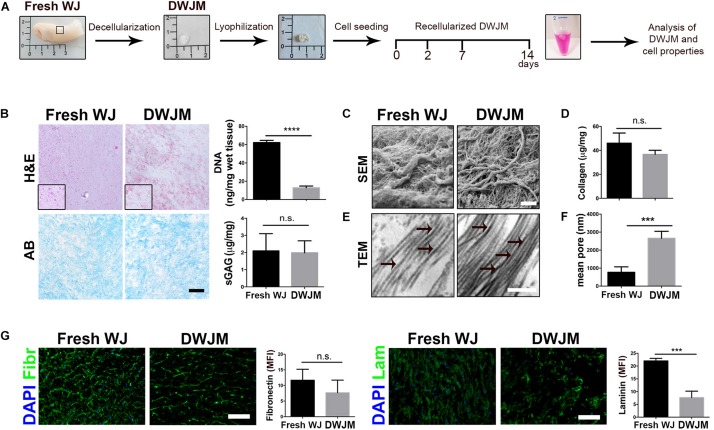
FIGURE 1.
Preparation and characterization of decellularized human Wharton’s jelly matrix (DWJM). (A) Scheme of the different steps of the experimental plan: the gross appearance of Wharton’s jelly freshly isolated (Fresh WJ), Wharton’s jelly after decellularization (DWJM) and lyophilization process has been reported. After seeding of IVD cells or MSCs cells, the recellularized DWJM was kept in culture up to 14 days and then investigated. (B) Representative images of the histological analysis performed on Fresh WJ and DWJM by hematoxylin-eosin (H&E) and Alcian Blue (AB) staining. In the graphs the quantification of the residual DNA and total sulfated proteoglycans and glycosaminoglycans (sGAG) content is also reported. ****p < 0.0001; n.s., non-significant. Bar: 50 μm. (C) Representative images of SEM analysis of Fresh WJ and DWJM. Bar: 5 μm. (D) The quantification of the total collagen content (μg/mg of tissue) is reported in the graph. n.s., non-significant. (E) Representative images of TEM analysis of Fresh WJ and DWJM. Bar: 200 nm; black arrows indicate collagen fibers with visible cross-striation pattern. (F) Mean diameter of the pores (nm) is reported in the graph. ***p < 0.001; 10 analyzed fields, n = 3. (G) Representative images of the immunofluorescence analysis of Fibronectin (Fibr, in green), and Laminin (Lam, green) expression performed on Fresh WJ and DWJM. Nuclei were counterstained with DAPI (in blue); the results are expressed as mean fluorescence intensity (MFI, arbitrary unit) evaluated for 10 fields, n = 3. ***p < 0.001; n.s., non-significant. Bars: 50 μm.

