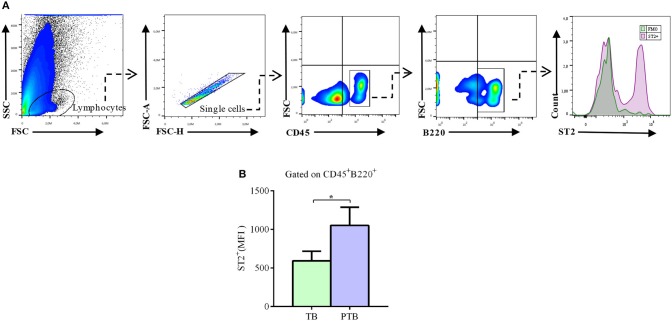
Figure 6.
Expression levels of ST2 in decidual B cells during the acute phase of LPS-induced preterm birth. (A) Representative pseudocolor plots and histogram showing gating strategy used to quantify the expression of ST2 in decidual B cells during the acute phase of LPS-induced preterm birth (PTB) and in term birth mice (TB). Lymphocytes were gated by FSC vs. SCC and doublets were eliminated. After gating in total CD45+ leukocytes, B220 was used to identify total decidual B cells. Fluorescence minus one (FMO) was used as control. (B) Bar graph shows median of fluorescence intensity (MFI) for ST2 in decidual B cells from TB (n = 6) and PTB mice (n = 6). Data is expressed as mean ± SEM. *p < 0.05 as analyzed by Wilcoxon test.

