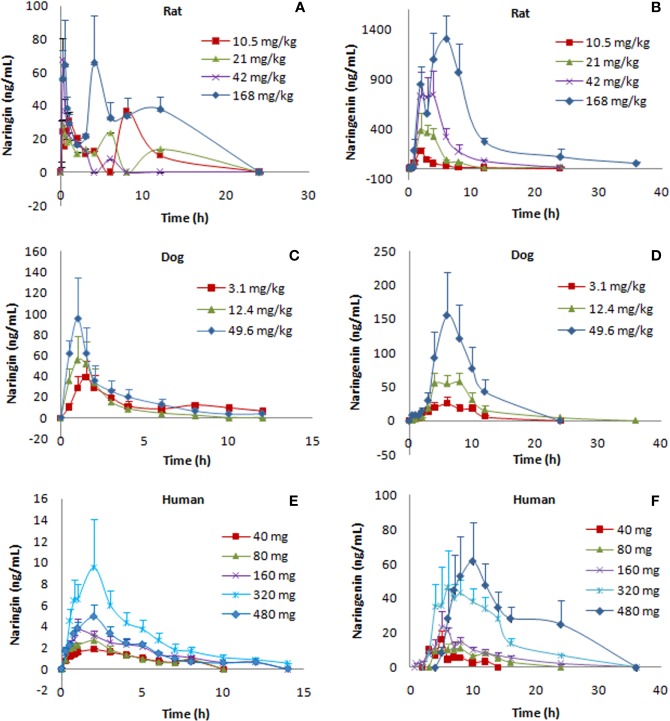
Figure 1.
Plasma level-time curves for naringin and naringenin after oral administration (p.o.) of naringin at different doses in rats, dogs, and humans (n=10 per group of rats, n=6 per group of dogs, n=8 per group of humans, mean ± SE). The PK profiles were presented as follows: naringin (A) and naringenin (B) PK profiles of naringin (10.5, 21, 42, and 168 mg kg-1) in rats; naringin (C) and naringenin (D) PK profiles of naringin (3.1, 12.4, and 49.6 mg kg-1) in dogs; naringin (E) and naringenin (F) PK profiles of naringin (40, 80, 160, 320, and 480 mg) in humans.

