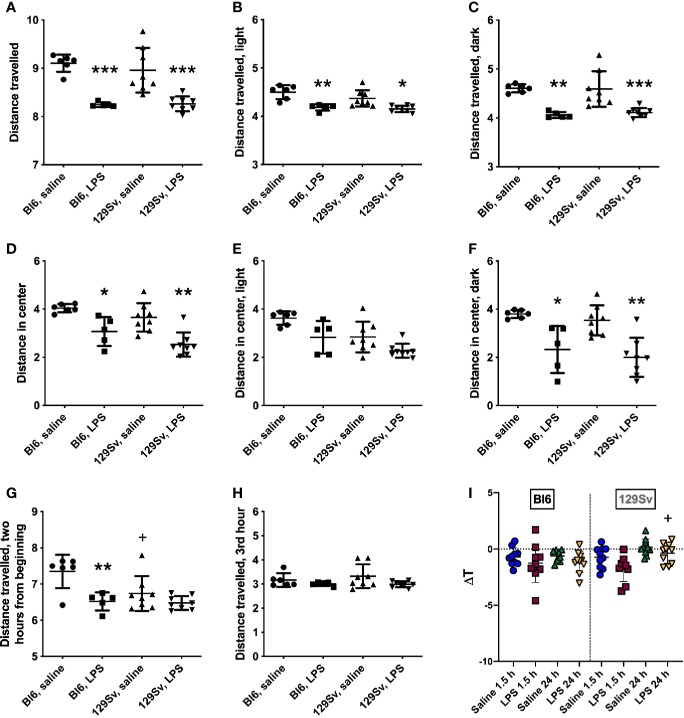
Figure 2.
Locomotor activity (log10 values, data expressed as mean ± SD) of Bl6 and 129Sv mice in the 24 h LPS challenge. (A) Total distance travelled in 24 h period. (B) Total distance travelled in lights-on period. (C) Total distance travelled in lights-off period. Center distance travelled in 24-h cycle (D), lights-on (E) and lights-off (F) periods. Distance travelled 2 h from the beginning (G) and on the third hour (H). * significant difference between LPS and saline administration groups (Bonferroni’s multiple comparisons): *p ≤ 0.05, **p ≤ 0.01, ***p ≤ 0.001; +significant difference between Bl6 and 129Sv mice in saline administration groups, +p ≤ 0.05. (I) Body temperature (ΔT) change 1.5 and 24 h after 0.5 mg/kg LPS administration in Bl6 and 129Sv. Values are represented as mean ± SD. Two-way ANOVA followed by Bonferroni post hoc test: + a significant difference between LPS treatment groups: +p < 0.05.

