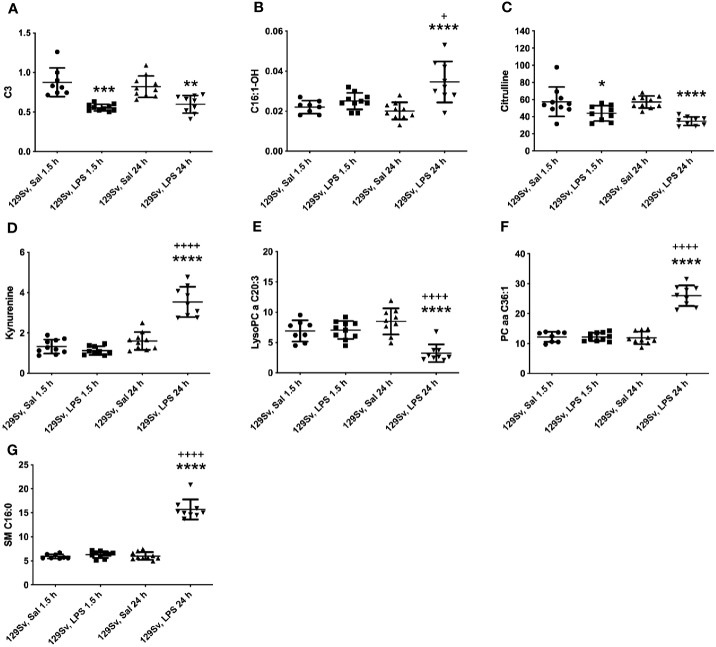
Figure 4.
LPS treatment-induced changes in concentrations of (A) SCACs (C3), (B) hydroxylated LCACs (C16:1-OH), (C) citrulline, (D) KYN, (E) lysophosphatidylcholines (C20:3), (F) phosphatidylcholine diacyls (C36:1) and (G) sphingolipids (C16:0) in 129Sv mice 1.5 and 24 h after administration. Data was analyzed by two-way ANOVA followed by the Bonferroni post hoc test. *significant p value between saline and LPS treatment; +significant p value between 1.5 h and 24 h LPS treatments. *p ≤ 0.05, **p ≤ 0.01, ***p ≤ 0.001, ****p ≤ 0.0001, ++++p ≤ 0.0001.

