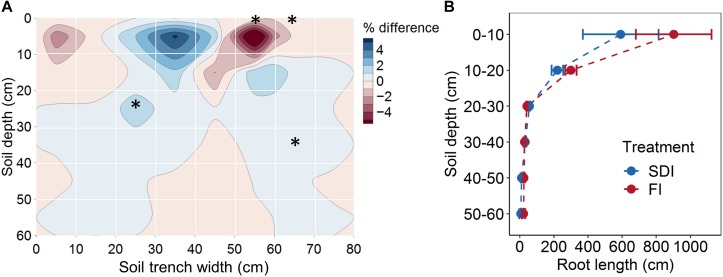
FIGURE 2.
(A) Root distribution by position and (B) root length at different soil depths of tomato plants in subsurface drip irrigation (SDI) and furrow irrigation (FI) systems. Root distribution in (A) was calculated as the difference in the percentage of root length contained in each quadrat between two irrigation treatments. Blue shades represent a higher percentage in SDI than FI, and red shades represent a lower percentage in SDI than FI. Asterisks represent significant differences (p < 0.05) between two irrigation systems. Error bars represent the standard error of the mean.

