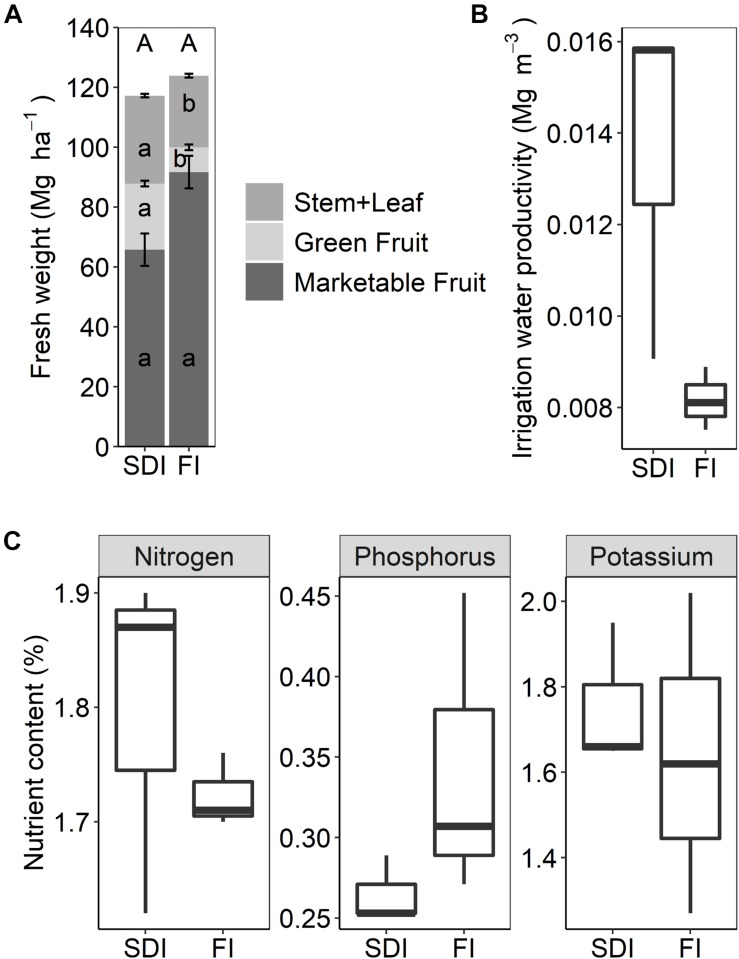
FIGURE 5.
(A) Marketable yields and aboveground biomass of processing tomato, (B) boxplots of irrigation water productivity, and (C) boxplots of nitrogen, phosphorus, and potassium content in aboveground plant tissues in subsurface drip irrigation (SDI) and furrow irrigation (FI) systems. Letters represent significant differences (p < 0.05) between two irrigation treatments. Error bars represent the standard error of the mean.

