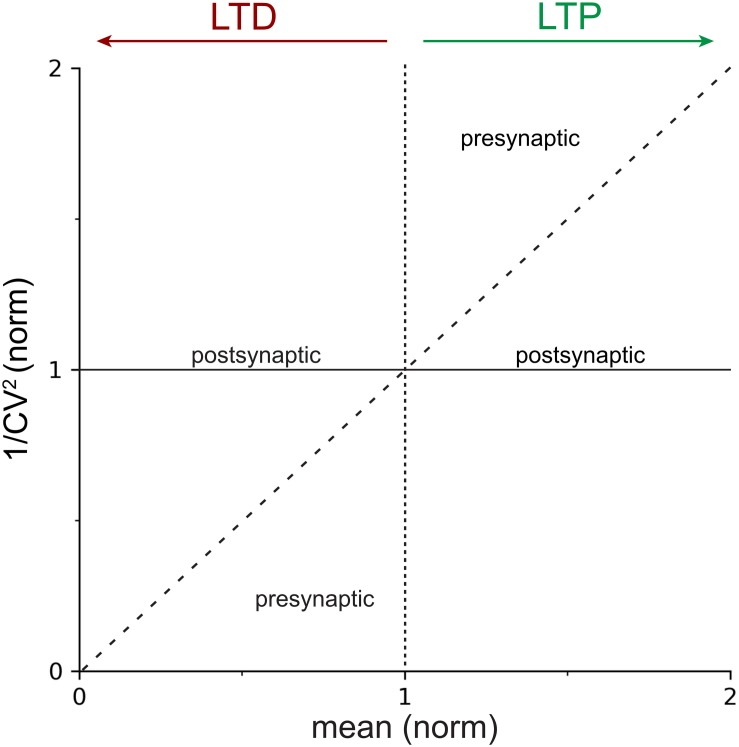
FIGURE 1.
Locus of expression areas in the CV analysis plot. Normalized 1/CV2, a proxy for the probability of release p (Box 2), is plotted against the normalized mean μ(norm), which is a measure of synaptic strength. The solid horizontal line at y=1 indicates 100% 1/CV2(norm), or no change in p. The dotted vertical line at x=1 delineates LTP (to the right) from LTD (to the left). The dashed diagonal line with slope Δy/Δx = 1 demarcates presynaptic from postsynaptic expression of plasticity (Box 2). In other words, data that falls on or close to the continuous horizontal line should be considered to be postsynaptically expressed, whereas data that is above the dashed diagonal for LTP, or below it for LTD, should be considered presynaptically expressed. Mixtures of pre- and postsynaptic expression is also possible (Sjöström et al., 2007), which results in data points scattered between the dashed diagonal and the continuous horizontal lines.

