FIGURE 5.
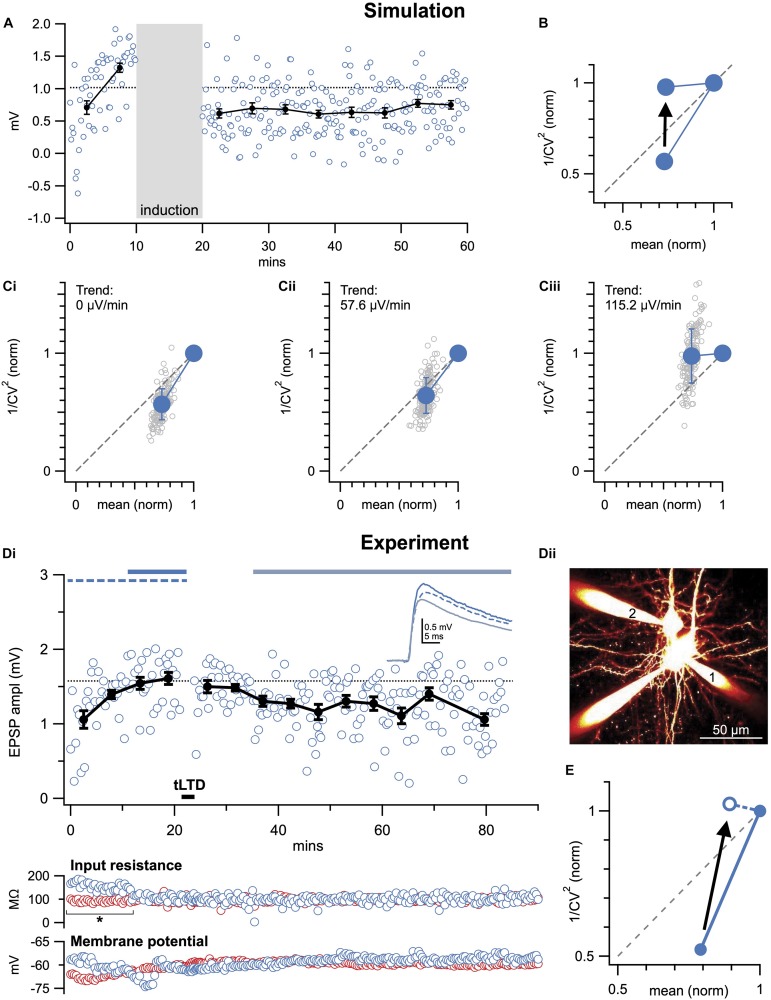
Baseline trends may corrupt CV analysis. (A) Sample Monte-Carlo simulation of an individual presynaptically expressed LTD experiment that was suffering from a strong baseline run-up (115.2 μV/min, see section “Materials and Equipment”). (B) With baseline trend (115.2 μV/min as in A), CV analysis was on average biased to erroneously indicate post-instead of presynaptic expression (arrow). In the case of LTP, CV analysis would instead be biased toward presynaptic expression (not shown, but possible to simulate in downloadable code, see section “Materials and Equipment”), because the baseline trend artificially elevates the y-axis coordinate. However, if the baseline trend is in the post-induction period, the bias is in the opposite direction. (C) As in (A), 150 individual simulations (gray circles) were systematically repeated for different baseline trends (0, 57.6, and 115.2 μV/min shown in Ci–iii). The increasing baseline trend systematically biased outcome toward a postsynaptic interpretation (summarized in B). (D) Sample LTD experiment (Di, Δt = −25ms and 20 Hz as in Figures 2, 3) at PC1 → PC2 connection (Dii) that suffered from an increasing baseline trend, coincident with a significant change in postsynaptic input resistance (bottom: blue circles, asterisk). Presynaptic input resistance and membrane potential are indicated in red. (E) By including the entire baseline period, CV analysis was biased toward postsynaptic interpretation (arrow). Here, this pitfall was avoided by removing the unstable baseline period, which was further supported by a significant change in input resistance (* in Di).

