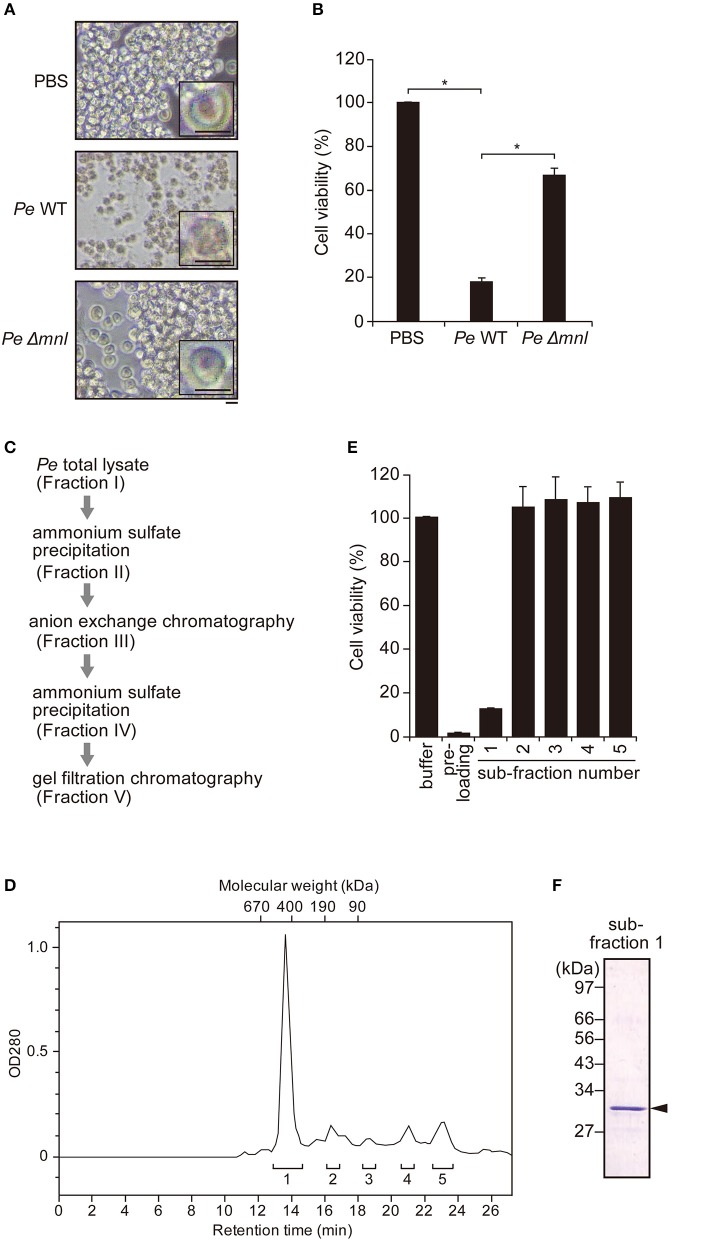
Figure 1.
Purification of endogenous pro-Monalysin from P. entomophila. (A) Phase contrast images of S2 cells after incubation with PBS, wild type (Pe WT) or Monalysin-deficient strain (Pe Δmnl) of P. entomophila extracts (15 μg protein/8 × 105 cells in 100 μL) for 12 h. Magnification images are shown in the square on the right side. Scale bar; 20 μm. The space around the S2 cells after incubation with Pe WT extracts appears whiter than others, due to cell debris. (B) S2 cells were incubated with Pe WT or Pe Δmnl total lysates (15 μg protein/8 × 105 cells in 100 μL) for 12 h. Cell viability was monitored as luminescence by a CellTiter-Glo Luminescent Cell Viability Assay. Cell viability is shown relative to luminescence in cells that were incubated with PBS, taken as 100%. The means ± S.E. obtained with the data from triplicate samples, are presented (*P < 0.05, as determined by a Student's t-test). (C) The purification step of endogenous pro-Monalysin. A HiTrap Q HP column and a Superdex 200 Increased 10/30 L GL column were used in anion exchange chromatography and gel filtration chromatography, respectively. (D) Chromatogram of gel filtration chromatography. Eluted proteins were detected by measuring OD280. The retention time was the time passed after loading the sample into the column. The molecular weight of each retention time was estimated by loading Gel filtration Calibration Kit HMW (GE Healthcare) in the same column. The estimated molecular mass was around 460 kDa for the first eluted peak. Pre-loading indicates a fraction before loading to column for gel filtration chromatography (that is, it is the same Fraction IV in Table 1). Brackets and numbers were collected fractions and sub-fraction numbers, respectively. (E) S2 cells were incubated with each fraction obtained from gel filtration chromatography for 12 h. Cell viability was monitored as luminescence by a CellTiter-Glo Luminescent Cell Viability Assay. Cell viability is shown relative to luminescence in cells incubated with an elution buffer, taken as 100%. The means ± S.E. obtained with the data from triplicate samples, are presented. (F) SDS-PAGE analysis of fraction 1. The gel was stained with Coomassie Brilliant Blue. The arrowhead indicates a pro-Monalysin monomer (30 kDa). The numbers on the left side indicate molecular weight.

